Baseball OPS Calculator (OBP & Slugging)
Badge official mlb ruleBadge sabermetric cockpitMLB Modern Standard (162-Game Baseline)

Baseball OPS Calculator (OBP & Slugging)

Calculate baseball OPS instantly with OBP and slugging percentage formulas. Analyze slash lines, isolated power, OPS+, and reverse target stats for players.

Lbl quick presets

Title input deck

Badge mode box
162 Lbl games

lgOBP .312, lgSLG .399, lgOPS .711 (Neutral Park Factor 100)

Sec plate turns
650
Hint pa total1 - 800
550
Hint ab excluded1 - 650
Sec hit distribution95 Lbl singles short
165
Hint hits sum0 - 550
Lbl doubles34
Lbl triples4
Lbl home runs32
Sec discipline sacrifices
Lbl walks80
Lbl hit by pitch6
Lbl sacrifice flies5
Lbl strikeouts110
Sec context target
100
Hint park neutral80 - 130
.900
Hint target benchmark.500 - 1.400
Kpi ops title
.942
MVP Contender
Kpi obp title
.392
Kpi obp subtitle
Kpi slg title
.551
303 Lbl unit bases
Kpi ops plus title
164
+64% Lbl vs avg

Title svg gauge

MVP Contender
.942Lbl combined opsTop 3% (Premier Superstar)
Lbl outer ring.392
Lbl inner ring.551
Lbl target goal.900
Lbl triple slash hero
.300/.392/.551=.942
Lbl obp formula.392

Lbl obp explained

(165 + 80 + 6) / (550 + 80 + 6 + 5)
Lbl slg formula.551

Lbl slg explained

303 Lbl unit bases / 550 Lbl unit ab
Lbl total bases share (303 Lbl unit bases)70 Lbl xbh short (42%)
Lbl singles abbr (95)Lbl doubles abbr (68)Lbl triples abbr (12)Lbl hr abbr (128)
Stat1 label117.8 Lbl unit runs

Stat1 sub

Stat2 label12.3% Lbl bb rate short / 16.9% Lbl k rate short

Stat2 sub

Stat3 label1.84 Lbl bp hit

Stat3 sub

Lbl analytical disclaimer

Client-Side Processing

High-performance calculation executed entirely in browser memory.

Zero Server Upload Privacy

All payloads remain strictly local with zero external server communication.

Production Ready Export

Clean, optimized output formats ready for immediate deployment.
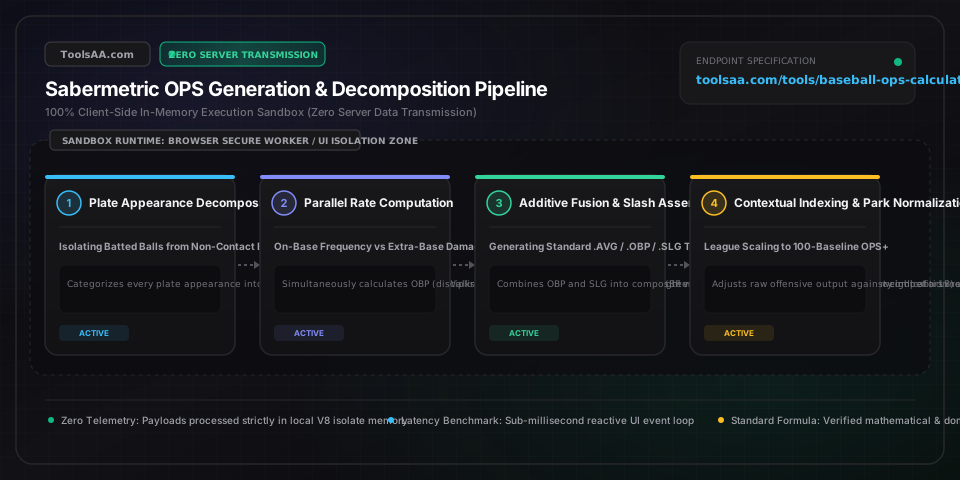
Technical Reference & Architecture Guide

Baseball OPS Calculator (OBP & Slugging) Guide

Calculate baseball OPS instantly with OBP and slugging percentage formulas. Analyze slash lines, isolated power, OPS+, and reverse target stats for players.

Baseball OPS Calculator (OBP & Slugging) Guide — Client-Side In-Memory Architecture & Data Flow

Key Parameters & Controls

On-Base Percentage (OBP)Decimal Rate (.000 to 1.000)

Proportion of plate appearances resulting in reaching base safely without fielding errors or fielder choices. MLB average hovers around .312; elite benchmark begins at .380+.

Default: .383
Slugging Percentage (SLG)Decimal Rate (.000 to 4.000)

Total bases achieved per official at-bat. MLB average sits near .400; premium power hitters exceed .500, with historic MVP ceilings surpassing .650.

Default: .545
On-Base Plus Slugging (OPS)Decimal Sum (.000 to 5.000)

Linear addition of OBP and SLG. Established benchmark bands: Poor (<.670), Below Average (.670-.710), Average (.711-.740), Above Average (.741-.820), Great (.821-.899), Elite/MVP (.900+).

Default: .928
Adjusted OPS+ (OPS Plus)Integer Scale (100 = Neutral)

Normalized metric adjusting for ballpark run environment and league context. 100 represents exactly league-average; 150 indicates 50% more productive than league peers.

Default: 154
Isolated Power (ISO)Decimal Rate (.000 to 3.000)

Raw extra-base slugging productivity calculated as SLG minus Batting Average. League average is ~.150; .200+ signifies genuine plus power; .250+ is elite.

Default: .245
Sacrifice Flies (SF) vs Sacrifice Hits (SH)Count Tally

Critical denominator distinction under MLB Rule 9.21(f): SFs are added into the OBP denominator, whereas SHs (sacrifice bunts) are omitted completely from OBP.

Default: 5

Pro Tips & Best Practices

The Equal-Weighting Fallacy in Raw OPS

Raw OPS treats one point of OBP identically to one point of SLG, yet empirical sabermetric linear weights show that an on-base point is worth roughly 1.8 times more than a slugging point in creating runs. A player with .400 OBP / .450 SLG (.850 OPS) generates significantly more actual team runs than a player with .310 OBP / .540 SLG (.850 OPS).

Sacrifice Bunts vs Sacrifice Flies Asymmetry

Never include sacrifice bunts (SH) in your OBP denominator. Under MLB Rule 9.21(f), a sacrifice fly damages a player's OBP because it counts as an appearance without reaching base, but a sacrifice bunt is treated as an unselfish managerial tactical order and is completely exempted from OBP calculations.

Singles Derivation from Box Scores

Box scores do not list singles explicitly; they list Total Hits. Always calculate singles as Hits minus the sum of 2B, 3B, and HR before calculating total bases. Entering Total Hits into the singles slot double-counts extra-base hits and produces an impossibly bloated slugging percentage.

Small Sample Stabilization Thresholds

OPS over fewer than 100 plate appearances is dominated by batting average fluctuation on balls in play. In Major League Baseball research, OBP requires approximately 460 plate appearances to stabilize, while SLG stabilizes around 320 at-bats. Treat April and early-season 1.200 OPS surges with statistical skepticism.

Common Gotchas & Troubleshooting

⚠️OBP Displays Lower than Batting Average (AVG)

This is mathematically legitimate when a hitter records numerous Sacrifice Flies with minimal walks and hit by pitches. Because SFs are added to the OBP denominator but excluded from at-bats in AVG, an 0-for-3 day with two sacrifice flies lowers OBP while keeping AVG steady.

⚠️Total Calculated Plate Appearances Do Not Match Scorecard

Verify that your sum includes all five components: At-Bats + Walks + Hit-by-Pitches + Sacrifice Flies + Sacrifice Bunts. Also verify whether catcher interference occurred, which awards first base without counting as an official at-bat or walk.

⚠️OPS Value Exceeds 1.000 and Seems Invalid

Unlike Batting Average and OBP which ceiling at 1.000, OPS is the combination of two rates where SLG can reach 4.000 (four total bases per at-bat). The theoretical absolute maximum OPS is 5.000 (1.000 OBP + 4.000 SLG). Any OPS above .900 is simply elite Major League production.

⚠️At-Bats Greater than Plate Appearances Error

At-Bats are a strict mathematical subset of Plate Appearances. If your recorded AB exceeds PA, check for transposed digits; At-Bats can never exceed Plate Appearances under any official baseball scoring rules.

Frequently Asked Questions

How do you calculate OPS in baseball?▼

OPS is calculated by adding On-Base Percentage (OBP) to Slugging Percentage (SLG): OPS = OBP + SLG. OBP measures how often a batter reaches base safely via hits, walks, or hit-by-pitches divided by (AB + BB + HBP + SF). SLG measures total bases earned per at-bat: (1B + 2*2B + 3*3B + 4*HR) / AB.

What is considered a good OPS in baseball?▼

In modern Major League Baseball, a league-average OPS is approximately .710 to .720. An OPS of .750 is solid, .800 is considered good (above-average starter), .850 is All-Star caliber, and any OPS of .900 or higher represents elite MVP-level offensive production. Anything below .650 is generally below replacement level.

What is the difference between OPS and OPS+?▼

OPS is a raw unadjusted total of OBP plus SLG, whereas OPS+ (Adjusted OPS) is an index that normalizes a player's OPS against the league average and adjusts for their home ballpark's offensive environment. An OPS+ of 100 is exactly league-average; an OPS+ of 140 means the hitter was 40% more productive than the league average after park factors are accounted for.

Can On-Base Percentage (OBP) be lower than Batting Average?▼

Yes, OBP can be lower than batting average if a batter has more sacrifice flies than walks and hit-by-pitches combined. While sacrifice flies do not count as official at-bats (protecting batting average), they are included in the denominator for OBP, thereby reducing the on-base percentage.

Why is OPS more useful than Batting Average?▼

Batting average treats all hits equally (a single equals a home run) and completely ignores walks. OPS accounts for how frequently a player avoids making outs (OBP) and gives appropriate bonus weight to extra-base hits (SLG), correlating far more strongly with actual team runs scored than batting average alone.

Related Tools & Utilities

All Tools →