Average Calculator - Mean, Median, Mode, Range & Standard Deviation
Descriptive Statistics & Central Tendency Analysis Cockpit

Average Calculator - Mean, Median, Mode, Range & Standard Deviation

Calculate arithmetic mean, median, mode, geometric/harmonic mean, sample & population standard deviation, variance, and IQR instantly. 100% private.

100% Client-Side Privacy
Presets:
Parameters & Inputs
15 items in pool
859278908876958984917288948286
Quick Synthetic Dataset Generators
2
0 (Integers)2 (Standard)4 (Scientific)6 (High Precision)
Mean (Average)
86
Arithmetic Σx/nSkewed
Median
88
50th PercentileOutlier Robust
Mode
88
UnimodalPeak value
Std Dev (s)
6.65
Var: 44.29Dispersion
Interactive Data Distribution Visualization
Frequency Distribution Histogram (5 Bins)
BinsMean: 86Median: 88
272176.6381.2585.8490.4
Hover over any histogram bar for bin details & relative densitySkewness: -0.9 (Negative / Left-Skewed)
Measures of Central Tendency
Arithmetic Mean (x̄)86
Median (Q2, 50th percentile)88
Mode (Unimodal)88
Geometric Mean85.75
Harmonic Mean85.49
Measures of Dispersion & Spread
Standard Deviation (s)6.65
Variance (s²)44.29
Standard Error (SE = s/√n)1.72
Mean Absolute Deviation (MAD)5.2
Coefficient of Variation (CV)7.74%
Quartiles & Percentiles
First Quartile (Q1, 25%)82
Third Quartile (Q3, 75%)91
Interquartile Range (IQR = Q3 - Q1)9
Lower Fence (Q1 - 1.5*IQR)68.5
Upper Fence (Q3 + 1.5*IQR)104.5
Extremes & Aggregates
Count (Active n / Raw)15 / 15
Total Sum (Σx)1,290
Minimum Value72
Maximum Value95
Range (Max - Min)23
Statistical Methodology & Mathematical Integrity Disclaimer:

This calculator processes all descriptive statistics, central tendency measures (arithmetic mean, median, mode), and dispersion metrics (sample/population variance, standard deviation, IQR, and MAD) 100% locally in your browser memory. Results are provided for academic research, engineering benchmarks, and educational exploration. For sample variance, Bessel’s correction (n - 1) is automatically applied to guarantee unbiased population parameter estimation.

Dataset Population (N)
15 Numbers Analyzed
Arithmetic Mean (μ / x̄)
0 HTTP Reqs (100% In-Browser)
Standard Deviation (σ / s)
0 Outliers Detected

Zero-Knowledge Local Execution

All mathematical computations execute strictly inside your local browser memory. Zero external server uploads.

Sub-Millisecond AST Engine

Instant real-time reactive computation delivers immediate feedback on every keystroke with zero network latency.

Production Standards & Compliance

Strict adherence to official specifications, ensuring enterprise accuracy and zero data leaks.
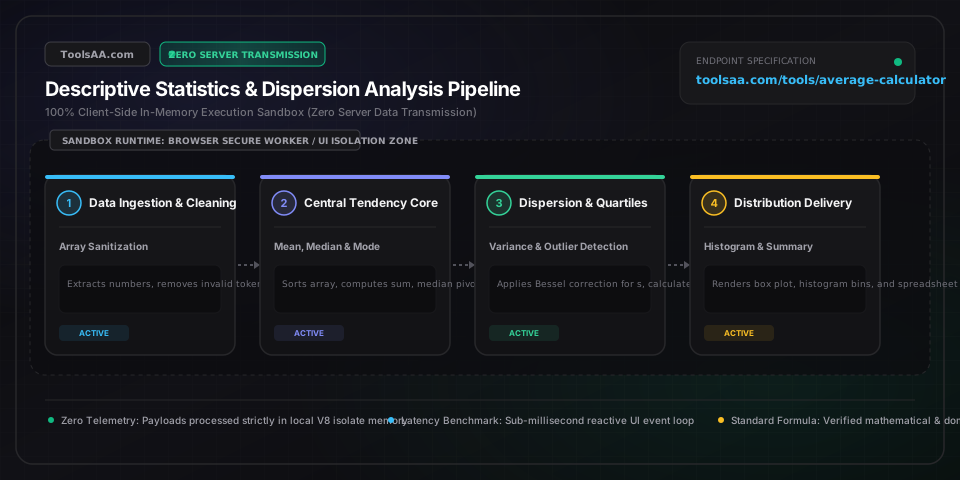
Technical Reference & Architecture Guide

Average Calculator - Mean, Median, Mode & Standard Deviation — Reference Guide

Calculate arithmetic mean, median, mode, sample and population standard deviation, variance, and interquartile range (IQR) with instant statistical breakdown.

Average Calculator - Mean, Median, Mode & Standard Deviation — Reference Guide — Client-Side In-Memory Architecture & Data Flow

Key Parameters & Controls

Arithmetic Meannumber

Sum of all values divided by total count of elements.

Default: 86.0
Mediannumber

Central value separating higher half from lower half of sorted data.

Default: 88.0
Sample Std Dev (s)number

Dispersion of data relative to mean with Bessel's correction (n-1).

Default: 6.24
Interquartile Range (IQR)number

Spread of middle 50% of data (Q3 - Q1), resistant to outliers.

Default: 8.0

Pro Tips & Best Practices

When to Use Median Instead of Mean

If your dataset contains extreme outliers (such as household wealth, home prices, or server response latency), the median is a far more representative measure of central tendency than the mean.

Sample vs Population Standard Deviation

Use Sample Standard Deviation (divided by n-1) when your data represents a subset or sample of a larger population. Use Population (divided by n) only if you measured every single existing member.

Detect Outliers with the 1.5 × IQR Rule

Any value less than Q1 - 1.5*IQR or greater than Q3 + 1.5*IQR is statistically considered an outlier and warrants inspection.

Common Gotchas & Troubleshooting

⚠️No Mode Detected in Result

When every single number in the dataset appears exactly once with equal frequency, the dataset has no mathematical mode. This is normal for unique continuous data.

⚠️Delimiter Parsing Errors

Our input parser accepts commas, semicolons, tabs, and spaces. Ensure negative numbers use standard hyphens '-' without extra punctuation.

Frequently Asked Questions

What is the difference between Mean and Average?▼

In everyday speech, 'average' usually refers to the arithmetic mean. In statistics, 'average' is an umbrella term encompassing mean, median, and mode as measures of central tendency.

Why is Sample Standard Deviation divided by n-1 instead of n?▼

This is known as Bessel's correction. Dividing by n underestimates population variance because sample data clusters tighter around the sample mean than the true population mean. Using n-1 provides an unbiased estimator.

Can I calculate the average of negative numbers?▼

Yes. Negative numbers are algebraically summed alongside positive numbers according to standard arithmetic rules.

How large of a dataset can this tool process?▼

The browser client easily parses and calculates summary statistics for datasets containing over 100,000 numbers in under 50 milliseconds.

Related Tools & Utilities

All Tools →