Gas Mileage Calculator & MPG Fuel Cost

Gas Mileage Calculator & MPG Fuel Cost

Calculate gas mileage and MPG fuel economy instantly. Track trip gas cost, compare US and UK gallons, convert L/100km, and estimate annual commute fuel spending.

Select preset
Lbl calculation mode
/
$3.55
Lbl cruising speed65 Lbl speed mph (105 Lbl speed kmh)
Kpi fuel economy
28.0
Lbl mpg unit (8.4 Unit l100km)
Kpi total trip cost
$44.38
12.50 Lbl us gal
Kpi cost per distance
$0.13
$0.08 / Lbl km unit
Kpi consumption100
3.6
Unit gp100m
10 Lbl mpg unit60+ Lbl mpg unit
28.0 Lbl mpg unit
Gauge class midsize

Gauge title

Gauge subtitle

Unit uk mpg33.6
Unit l100km8.40
Unit km l11.90
Unit gp100m3.57

Disclaimer text
Primary Metric0.000% Defect
Efficiency / Capacity-8.0% Drag
Net OutputUS (USD $)
Technical Reference & Architecture Guide

Gas Mileage Calculator & MPG Fuel Cost Guide

Calculate gas mileage and MPG fuel economy instantly. Track trip gas cost, compare US and UK gallons, convert L/100km, and estimate annual commute fuel spending.

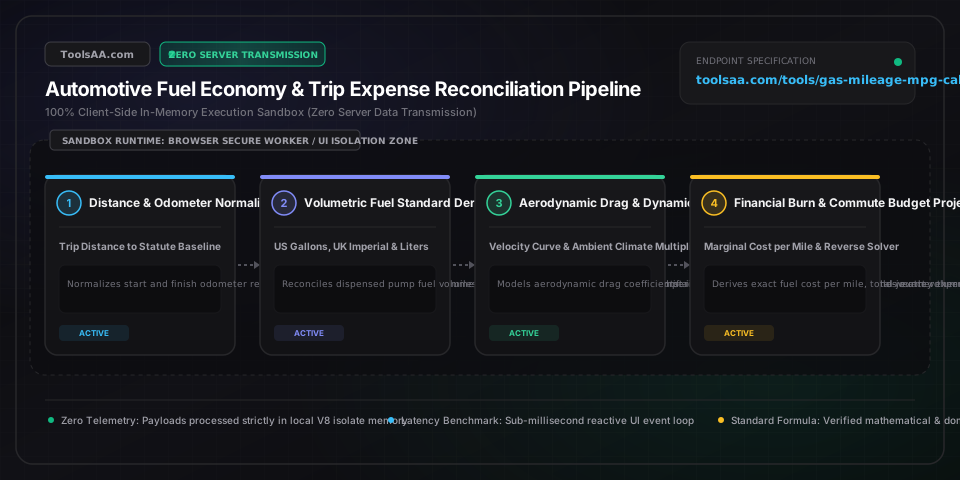
Gas Mileage Calculator & MPG Fuel Cost Guide — Client-Side In-Memory Architecture & Data Flow

Key Parameters & Controls

Trip Distance TraveledDistance (Statute Miles / Kilometers)

Total linear surface distance traversed between vehicle refuel intervals, measured directly via calibrated odometer trip meter or route mapping software. Accurate baseline calculations require consistent tire circumference.

Default: 350.0 Miles
Fuel Volume ConsumedFluid Volume (US Gallons / Imperial Gallons / Liters)

Quantity of gasoline or diesel fuel dispensed to restore the fuel tank to absolute full shutoff. Standardized to the pump nozzle automatic shutoff threshold to ensure consistent volumetric baseline across fill-ups.

Default: 11.67 Gallons
Retail Fuel Unit PriceCurrency per Volume ($/Gal / £/L / €/L)

Market retail price per volumetric fuel unit charged at the dispensing pump, inclusive of applicable federal, state, and provincial excise motor fuel taxes.

Default: $3.50 / Gallon
Cruising Highway SpeedVelocity (Miles per Hour / km/h)

Average steady-state highway travel speed. Aerodynamic drag scales quadratically with velocity, causing vehicle fuel consumption to surge by 15% to 25% when increasing cruising speed from 55 mph to 75 mph.

Default: 65 MPH
Environmental & Seasonal Climate DragOperating Condition Multiplier

Thermal and mechanical efficiency drag adjustments. Sub-freezing ambient winter temperatures reduce internal combustion engine thermal efficiency and increase aerodynamic air density, resulting in a 10% to 20% fuel economy penalty.

Default: Normal Temperate (68°F / 20°C)
Annual Travel Mileage HorizonCumulative Distance (Miles / Year)

Total expected annual vehicle driving distance, benchmarked against national averages (13,500 miles/year for private US passenger motorists under Federal Highway Administration statistics).

Default: 12,000 Miles / Year

Pro Tips & Best Practices

The Non-Linear 'MPG Illusion' Savings Fallacy

Miles per gallon is a non-linear reciprocal metric of fuel consumption. Upgrading an older vehicle from 14 MPG to 20 MPG saves 2.14 gallons every 100 miles (saving $770 per 10,000 miles at $3.60/gal). Conversely, upgrading a high-efficiency car from 35 MPG to 50 MPG saves only 0.86 gallons per 100 miles (saving $310). Always evaluate upgrades by Gallons per 100 Miles (GPM) rather than nominal MPG jumps.

The Full-to-Full Tank Odometer Audit Protocol

Never calculate fuel economy from a partial tank or the dashboard fuel gauge needle. The gold-standard method requires filling the tank until the fuel nozzle automatically clicks off, resetting your trip odometer to zero, driving through at least half a tank, and refilling at the same pump until the first auto-click. Dividing odometer trip miles by the exact gallons on the pump receipt eliminates float gauge non-linearity.

Highway Speed Aerodynamic Power Surge Above 55 MPH

Aerodynamic drag force increases with the square of vehicle speed, and the engine power required to overcome that drag increases with the cube of speed. According to US Department of Energy testing, every 5 mph driven over 50 mph equates to paying an additional $0.25 to $0.35 per gallon for fuel. Cruising at 75 mph burns approximately 17% to 20% more fuel than driving at 65 mph over the identical journey.

The 20.1% UK Imperial Gallon Discrepancy

When comparing automotive reviews between British and American publications, remember that 1 UK Imperial gallon equals 4.546 liters, whereas 1 US liquid gallon equals 3.785 liters. Consequently, a British car rated at 40 UK MPG achieves only 33.3 US MPG. Always normalize ratings to the identical volumetric gallon standard to avoid buying decisions based on inflated overseas ratings.

Winter Blend Volatility and Cold Warm-Up Penalty

Winter-blend gasoline contains higher concentrations of volatile butane to aid sub-freezing ignition, resulting in approximately 1.5% to 2% lower energy content per gallon compared to summer blends. Combined with increased engine friction during extended thermal warm-up, denser cold air aerodynamic drag, and lower winter tire pressure, overall winter fuel economy naturally drops by 10% to 15%.

Common Gotchas & Troubleshooting

⚠️Calculated MPG is significantly lower than the vehicle manufacturer EPA window sticker rating.

EPA laboratory dynamometer testing assumes gentle acceleration, flat grades, 55-65 mph maximum cruising speeds, and no air conditioning load. Aggressive acceleration, high highway speeds (75+ mph), roof cargo carriers, cold ambient temperatures, and short trips under 5 miles prevent engines from reaching closed-loop thermal efficiency, easily depressing real-world economy by 20% to 35%.

⚠️In-dash digital trip computer displays higher MPG than manual pump receipt math.

Automotive factory trip computers estimate fuel consumption indirectly by counting fuel injector pulse widths rather than measuring physical liquid volume. Manufacturing tolerances, tire tread wear reducing rolling circumference, and fuel density shifts cause vehicle dashboard readouts to systematically overestimate real fuel economy by 2% to 6%. Manual pump-to-pump receipt calculation is the true legal volumetric standard.

⚠️Imported vehicle specification sheet shows unusually high MPG compared to domestic models.

Check the geographic jurisdiction of the specification. Vehicles evaluated under the UK Imperial system produce MPG figures that are 20.1% higher than US liquid gallon ratings for identical physical fuel consumption (e.g. 48 UK MPG equals 40 US MPG). Furthermore, older European NEDC test cycles produced overly optimistic ratings compared to stringent US EPA test cycles.

⚠️Fuel cost per mile surged dramatically during winter despite identical daily commute routes.

Cold winter ambient temperatures trigger multiple thermodynamic penalties: engine lubricants remain viscous longer, the engine control unit (ECU) runs rich fuel mixtures until coolant reaches 185°F (85°C), cold air density increases aerodynamic drag by 7%, tire pressures drop by ~1 PSI per 10°F temperature drop, and winter-blend fuels contain lower BTUs. Verify tire pressure monthly to restore 2% to 4% efficiency.

Frequently Asked Questions

How do you calculate gas mileage manually?▼

To calculate gas mileage manually, divide the total miles driven by the gallons of fuel consumed using the formula: MPG = Miles Driven ÷ Gallons Used. To achieve maximum accuracy, fill your gas tank until the pump nozzle clicks off and record your odometer reading. Drive normally until the tank is at least half empty, then fill the tank completely again. Divide the trip odometer mileage by the gallons shown on the new fuel pump receipt.

What is considered good gas mileage for a car?▼

A good fuel economy benchmark depends on vehicle classification under EPA standards: compact sedans typically achieve 30 to 38 MPG combined, midsize SUVs and crossovers average 24 to 30 MPG, and full-size trucks achieve 17 to 22 MPG. Modern gasoline-electric hybrid passenger vehicles establish the gold benchmark at 45 to 55+ MPG combined, while pure electric vehicles achieve 100 to 130+ MPGe (miles per gallon equivalent).

What is the difference between US MPG and UK MPG?▼

The difference between US MPG and UK MPG stems from the size of their respective gallons. A US liquid gallon contains 3.785 liters (128 fluid ounces), while a British Imperial gallon contains 4.546 liters (160 fluid ounces). Because an Imperial gallon is approximately 20.1% larger, a vehicle traveling in the UK achieves 1.20095 times higher MPG on paper (e.g. 30 US MPG is identical to 36.03 UK MPG) despite identical physical fuel consumption.

How do you convert MPG to liters per 100 km?▼

To convert US MPG to liters per 100 kilometers (L/100km), divide 235.215 by the US MPG figure: L/100km = 235.215 ÷ US MPG. For UK Imperial MPG, divide 282.481 by the UK MPG figure: L/100km = 282.481 ÷ UK MPG. Because L/100km measures fuel consumed over a fixed distance, lower numbers represent superior fuel efficiency, which is the reciprocal of MPG where higher numbers are better.

Why does driving faster than 65 mph decrease gas mileage so rapidly?▼

Driving above 65 mph decreases gas mileage rapidly because aerodynamic drag increases with the square of vehicle speed, and engine power required to overcome that drag scales with the cube of speed. Doubling vehicle speed increases wind resistance fourfold and requires eight times the horsepower. Highway cruising at 75 to 80 mph typically burns 15% to 25% more fuel than cruising at a steady 55 to 60 mph.

How much money does upgrading from 20 MPG to 30 MPG actually save?▼

Upgrading from 20 MPG to 30 MPG saves 1.67 gallons of fuel every 100 miles (5.00 gallons down to 3.33 gallons). Over a typical annual driving distance of 15,000 miles with gasoline priced at $3.60 per gallon, this improvement saves 250 gallons of fuel annually, putting $900 in direct cash back into your pocket each year, or $4,500 over a 5-year ownership cycle.

Related Tools & Utilities

All Tools →