Short title

Net Revenue Retention Calculator & NDR

Professional SaaS Net Revenue Retention (NRR / NDR) and Gross Revenue Retention (GRR) intelligence calculator. Models customer cohort ARR/MRR dynamics including expansion upsells, contraction downgrades, and churn cancellations. Features an ARR movement waterfall bridge, SaaS Quick Ratio efficiency rating, 5-year compounding cohort decay projection, reverse expansion target solver, and sensitivity matrix benchmarked against top-decile BVP and OpenView SaaS standards.

Presets:

Title revenue inputs

Desc revenue inputs

$5,000,000
+$1,500,000 (30.00%)
-$100,000
-$150,000
+$2,000,000
Lbl cohort expansion pct:+30.00%
Lbl cohort loss pct:-5.00%
Lbl net expansion pct:+25.00%

Title reverse solver

Desc reverse solver

130%
80%100%120%140%160%
Lbl req expansion$1,750,000Lbl req expansion rate: 35.00%
Lbl max churn$0Assumes expansion rate remains constant
Hint target gapLbl expansion gap: Shortfall of $250,000

Logo Retention & ARPA Expansion Analysis

Whale bias detection: Distinguish account-level attrition from net dollar retention.

200
-6
Gross Logo Retention97.00%
Starting ARPA$25.0K
Ending Cohort ARPA$32.2K
Broad-based healthy expansion: High logo retention combined with strong account upgrades.

CFA Enterprise Valuation & Multiple Modeling

Forward ARR multiple sensitivity benchmarked to BVP Bessemer Cloud Index.

8.5x
2.0x (Trough)6.0x (Median)10.0x (Top Decile)18.0x (Hypergrowth)
Implied Enterprise Value (EV)$70,125,0008.5x × $8.25M Total Ending ARR
5-Yr Cumulative Cohort LTV$56,293,945Geometric cumulative retention sum

Title executive summary

Elite (Top Decile BVP)
Kpi nrr
125.00%
Benchmark: 120%+ BVP Elite
Kpi grr
95.00%
Max: 100% (No upsells)
Kpi quick ratio
14.00x
Mamoon Hamid: >4.0x
Kpi ending arr
$8.25M
+$3.25M Net New
Growth Efficiency Diagnostic (SaaS Quick Ratio)Lbl quick ratio formula
<1.0x Churn Trap1.0x-2.0x Low Efficiency2.0x-4.0x Healthy>4.0x Elite Hypergrowth

Title waterfall

Desc waterfall

$0$2.43M$4.87M$7.30M$9.73M$5.00MStarting Baseline+$1.50MExpansion (+)-$100.0KContraction (-)-$150.0KChurn (-)$6.25MEnding Cohort+$2.00MNew Logos (+)$8.25MTotal Ending ARR

Title compounding

Desc compounding

Th yearTh nrr cohort arrTh retention pctTh grr cohort arrTh delta
Year label 0 (Baseline)$5,000,000
100.00%
$5,000,000—
Year label 1$6,250,000
125.00%
$4,750,000+$1,250,000
Year label 2$7,812,500
156.25%
$4,512,500+$1,562,500
Year label 3$9,765,625
195.31%
$4,286,875+$1,953,125
Year label 4$12,207,031
244.14%
$4,072,531+$2,441,406
Year label 5$15,258,789
305.18%
$3,868,905+$3,051,758

Title sensitivity

Desc sensitivity

Lbl expansion short ↓ / Lbl loss short →2%5%8%10%12%15%20%
5% Lbl expansion short
103%
100%
97%
95%
93%
90%
85%
10% Lbl expansion short
108%
105%
102%
100%
98%
95%
90%
15% Lbl expansion short
113%
110%
107%
105%
103%
100%
95%
20% Lbl expansion short
118%
115%
112%
110%
108%
105%
100%
25% Lbl expansion short
123%
120%
117%
115%
113%
110%
105%
30% Lbl expansion short
128%
125%
122%
120%
118%
115%
110%
35% Lbl expansion short
133%
130%
127%
125%
123%
120%
115%
Lbl current position:
Lbl expansion short: 30.00%Lbl loss short: 5.00%Lbl nrr short: 125.00%
Disclaimer title

Disclaimer text
Kpi nrr125.00%
Kpi grr95.00%
Kpi quick ratio14.00x
Ending Cohort$6.25M
Kpi ending arr$8.25M
Implied EV$70.13M
Technical Reference & Architecture Guide

Net Revenue Retention Calculator & NDR Guide

Professional SaaS Net Revenue Retention (NRR / NDR) and Gross Revenue Retention (GRR) intelligence calculator. Models customer cohort ARR/MRR dynamics including expansion upsells, contraction downgrades, and churn cancellations. Features an ARR movement waterfall bridge, SaaS Quick Ratio efficiency rating, 5-year compounding cohort decay projection, reverse expansion target solver, and sensitivity matrix benchmarked against top-decile BVP and OpenView SaaS standards.

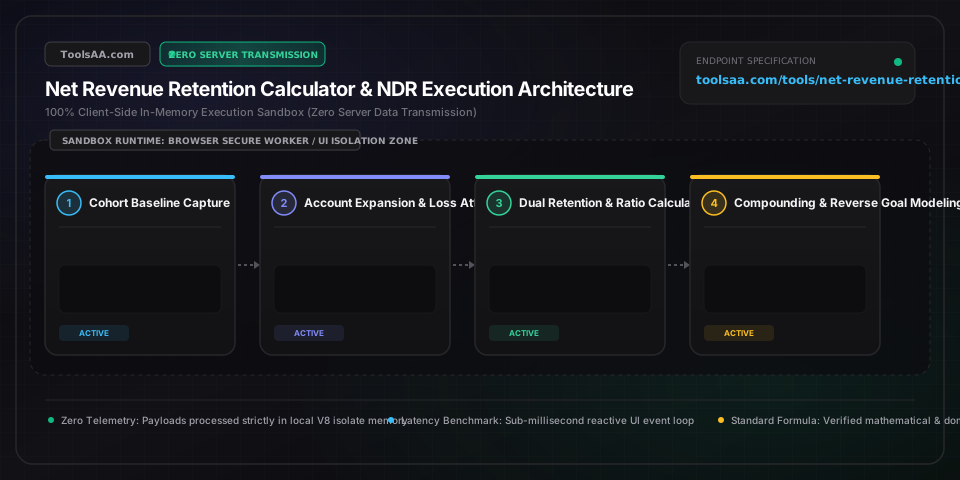
Net Revenue Retention Calculator & NDR Guide — Client-Side In-Memory Architecture & Data Flow

Key Parameters & Controls

Starting Cohort Revenue (Baseline ARR / MRR)Currency (USD / Annual)

Baseline recurring revenue from all paying customers active at the start of the measurement window (T=0), strictly isolating existing customers from new logo pipeline per ASC 606 revenue recognition guidelines. Must be greater than zero to establish a valid cohort denominator.

Default: $1,000,000
Expansion Revenue (Upsells, Cross-Sells & Seat Add-Ons)Currency (USD / Annual)

Additional contracted recurring revenue realized from the cohort through subscription tier upgrades, add-on modules, license seat additions, and contractual usage overages. Top-quartile enterprise B2B SaaS benchmarks target expansion exceeding 20% of starting ARR.

Default: $180,000
Contraction Revenue (Subscription Downgrades & Seat Reductions)Currency (USD / Annual)

Recurring revenue attrition caused by active cohort accounts downgrading subscription tiers, decommissioning user seats, or reducing committed consumption tiers. Best-in-class software operations restrict contraction ARR to less than 3% to 5% of starting revenue.

Default: $30,000
Churn Revenue (Full Account Cancellations & Non-Renewals)Currency (USD / Annual)

Complete loss of annualized recurring revenue resulting from client terminations, non-renewals, or insolvency. Institutional benchmarks for enterprise software (ACV > $50k) mandate annual logo churn under 5% to preserve enterprise value.

Default: $50,000
Target NRR Goal (Corporate Benchmark Objective)Percentage (%)

Executive retention objective used to reverse-engineer required expansion ARR or maximum allowable revenue attrition. Institutional venture-backed SaaS targets 110% to 125%+ (BVP Cloud Index median is ~114%).

Default: 115%
New Customer Acquisition Bookings (Optional Quick Ratio Input)Currency (USD / Annual)

New annualized recurring revenue (ARR) booked from first-time customer acquisitions over the matching measurement window. Used in conjunction with expansion ARR to evaluate the SaaS Quick Ratio (target benchmark > 4.0).

Default: $250,000

Pro Tips & Best Practices

Decouple Usage-Based Volatility from Contractual Baselines

For consumption-based and hybrid SaaS models (e.g., Snowflake, Twilio, Datadog), short-term consumption dips can trigger false churn alerts. Calculate NRR on a rolling Last-Twelve-Months (LTM) contracted baseline, segregating discretionary usage overage from committed minimum spend to avoid distorted covenant compliance metrics.

Audit GRR Alongside NRR to Detect Enterprise Whale Masking

A stellar 125% NRR can mask a catastrophic 75% Gross Revenue Retention (GRR) if massive expansions from a handful of enterprise 'whales' conceal rampant SMB account churn. In institutional M&A and venture audits, a GRR below 88% triggers severe valuation multiple discounts regardless of headline NRR.

Operationalize 90-Day Renewal Interventions Based on Lifetime Value Leverage

Financial sensitivity models demonstrate that reducing gross revenue churn by 1.0% yields 3.2x greater equity valuation expansion than an equivalent 1.0% increase in new logo acquisition, due to compounding cohort lifetime value (CLV = Gross Margin / Churn Rate). Trigger customer success triage at least 90 days prior to contract expiration based on product telemetry drops.

Neutralize the Division-by-Zero Asymptote in the SaaS Quick Ratio

When contraction and churn revenue approach zero, the SaaS Quick Ratio mathematically spikes toward infinity, creating an illusion of hyper-efficiency. Always qualify the Quick Ratio alongside absolute Net New ARR additions; a business generating $10k in expansion with zero churn has an infinite Quick Ratio but negligible enterprise value creation.

Common Gotchas & Troubleshooting

⚠️NRR Exceeds 100% but Total Corporate ARR and Operating Cash Flow Are Declining

Net Revenue Retention strictly isolates the historical customer cohort and ignores top-of-funnel customer acquisition pipeline. If new logo sales stall completely or customer acquisition costs (CAC) exceed payback horizons while fixed operating expenses escalate, cohort expansion cannot overcome enterprise-level cash burn. Model cohort retention alongside Net New ARR Bookings and the Rule of 40 (ARR Growth Rate + Free Cash Flow Margin) to ensure macroeconomic viability.

⚠️Calculated Gross Revenue Retention (GRR) Exceeds 100% or Disagrees with Cohort Decay

By strict financial definition, Gross Revenue Retention measures starting cohort revenue retained excluding all expansion, upsells, and cross-sells: GRR = [(Starting ARR - Contraction ARR - Churn ARR) / Starting ARR] × 100%. If your result exceeds 100%, expansion revenue has been erroneously factored into the numerator. Ensure upsell and seat expansion figures are isolated into NRR and excluded from the GRR numerator, capping the GRR ceiling at 100%.

⚠️SaaS Quick Ratio Yields Indeterminate Infinity or Disproportionate Volatility

A Quick Ratio approaching infinity occurs when the denominator (Contraction ARR + Churn ARR) equals zero. Implement a nominal mathematical lower bound floor (e.g., $1 or 0.01% of Starting ARR) or inspect input reconciliation to ensure reported churn is not being masked as accounts receivable aging write-offs or bad debt expense under GAAP instead of ARR churn.

Frequently Asked Questions

How to calculate Net Revenue Retention (NRR)?▼

Net Revenue Retention is calculated using the formula: NRR = [(Starting ARR + Expansion ARR - Contraction ARR - Churn ARR) / Starting ARR] × 100%. For example, if a SaaS company begins the fiscal year with $1,000,000 in Starting ARR, generates $200,000 in expansion upsells, suffers $30,000 in tier downgrades, and loses $70,000 to full account cancellations, the ending cohort revenue is $1,100,000. Dividing $1,100,000 by the starting $1,000,000 yields an NRR of 110%, representing 10% net expansion without acquiring any new logos.

What is a good Net Revenue Retention rate for B2B SaaS?▼

A good Net Revenue Retention (NRR) rate for enterprise B2B SaaS (ACV > $50,000) is 115% to 125%+, with top-decile cloud leaders like Snowflake, Datadog, and CrowdStrike historically achieving 125% to 135%+. For mid-market SaaS (ACV $10k–$50k), 100% to 110% is considered healthy, while self-serve SMB SaaS (ACV < $10k) typically benchmarks between 90% and 100% due to higher organic small-business mortality. Any NRR below 90% indicates severe product-market fit or value realization leakage that severely restricts capital efficiency and enterprise valuation multiples.

What is the difference between NRR and GRR?▼

The fundamental difference between Net Revenue Retention (NRR) and Gross Revenue Retention (GRR) is the treatment of expansion revenue. NRR accounts for expansion (upsells, cross-sells, seat additions) alongside downgrades and churn, allowing the ratio to exceed 100% and reflect overall cohort growth. In contrast, GRR isolates core customer durability by strictly subtracting contraction and churn from starting ARR [GRR = (Starting ARR - Contraction - Churn) / Starting ARR] and can never exceed 100%. While NRR demonstrates monetization power, institutional investors rely on GRR (benchmarked at >90% for enterprise software) to evaluate pure product stickiness and organic retention health.

Can Net Revenue Retention be over 100 percent?▼

Yes, an NRR exceeding 100% indicates 'negative net churn,' which is the definitive economic engine of compound SaaS growth. When NRR is above 100%, recurring revenue from existing customers expands faster than losses from cancellations and downgrades, meaning the business will organically increase total ARR year-over-year even with zero new customer acquisition. At 120% NRR, a $10M ARR customer cohort naturally compounds into $24.88M over 5 years without adding a single new customer account.

Does NRR include new customer acquisition revenue?▼

No, Net Revenue Retention strictly excludes new customer acquisition (new logos and first-time bookings). NRR isolates a static cohort of existing paying accounts established at the beginning of the measurement window (T=0) and tracks their financial evolution over a specified duration (typically 12 months). Including new customer revenue in NRR violates SaaS accounting standards and misleads valuation audits; new ARR additions are evaluated separately via Total ARR Growth Rate and the SaaS Quick Ratio.

How do you improve Net Dollar Retention quickly?▼

Disclaimer: This tool is provided strictly for educational and informational purposes only and does not constitute formal financial advice or a binding loan commitment. Please consult a qualified financial advisor before making decisions. To improve Net Dollar Retention (NDR) quickly, execute four high-impact financial and operational levers: 1) Transition pricing tiers to value-metric elasticity (such as active seats, API consumption, or compute units) so that customer business growth automatically expands contract values; 2) Package premium add-ons and security governance modules (e.g., SSO, SOC2 compliance reporting, audit logs) into enterprise tiers; 3) Implement 90-day pre-renewal telemetry tracking to detect dropped product usage and remediate churn risks before contract cancellation windows open; and 4) Incentivize multi-year upfront pre-commitments with indexed annual price escalation clauses (typically 3%–5%) to structurally neutralize contraction.

Related Tools & Utilities

All Tools →