ROAS & Target ROAS
ToolsAA Home•Unit Economics & Performance

ROAS Calculator & Break-Even Target ROAS

Calculate ROAS, break-even target ROAS, and net ad profit instantly. Model ad spend, gross margin, blended CAC, and required conversion rates for eCommerce ROI.

Presets:
Campaign ParametersPre-Tax Sales
Forward: Model profit & multipliers from Ad Spend and Attributed Revenue.
$10,000.00
$
$35,000.00
$
$85.00
$
15.0%
15%

Direct Unit Cost & Logistics Burdens

30% ($24.23 /ea)
5%
$6.50
$
2.9% + $0.30
$1.25
$
Achieved ROAS
3.50x
350.0%
Break-Even ROAS
1.80x
Minimum Hurdle
Target ROAS
2.46x
15% Net Goal
Net Ad Profit
$9,460.00
27.0% margin
Real-Time Dynamic Profit Threshold GaugeCapital Accretive: Above Target Margin
0.0x6.0x
3.50x
Current Evaluation ROAS
Break-Even Hurdle:1.80x
Pre-ad contribution margin ratio: 55.6%
Target ROAS Hurdle: (15%)2.46x
ROAS Safety Buffer: +1.70x
Max Allowable CPA:$34.51
Actual CPA: $24.29BE CPA: $47.26
Blended MER / Omnichannel
3.50x
Storefront Revenue ÷ Total Media Outlay
Campaign Orders Captured
412 orders
$22.97 profit / order
Required Storefront CVR
3.62%
At $1.25 CPC benchmark
CFA Strategic Advisory & Risk DisclosuresInstitutional Finance Standard

Attribution ROAS vs Blended MER Divergence

Ad platform reporting (Meta 7-day click, Google Ads) often double-counts touchpoints. Always reconcile channel ROAS with total blended Marketing Efficiency Ratio (Total Store Revenue ÷ Blended Spend) to detect platform inflation.

Cash Float & Return Lag Volatility

Customer return rates (3%–15%) create cash-flow latency where credit card chargebacks and reverse logistics costs hit weeks after ad invoices clear. Maintain working capital reserves during Q4 ad spend spikes.

Marginal ROAS & Diminishing Returns

Scaling ad budgets inevitably suffers audience saturation. The marginal ROAS on incremental spend drops before blended ROAS collapses. Use break-even targets as a firm risk boundary.
ROAS Safety Buffer+1.70x vs BE
Max Allowable Acquisition Cost$34.51 / order
Retained Operating Margin27.0% ($9,460.00)
Technical Reference & Architecture Guide

ROAS Calculator & Break-Even Target ROAS Guide

Calculate ROAS, break-even target ROAS, and net ad profit instantly. Model ad spend, gross margin, blended CAC, and required conversion rates for eCommerce ROI.

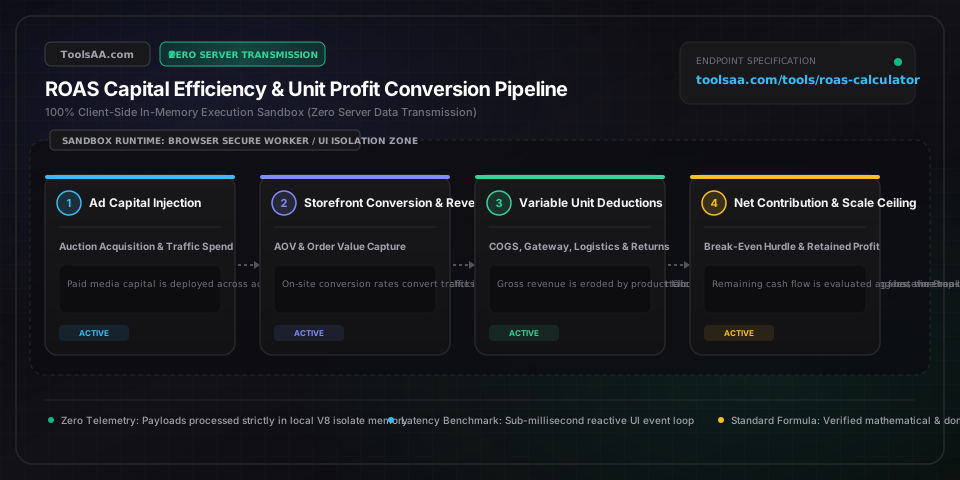
ROAS Calculator & Break-Even Target ROAS Guide — Client-Side In-Memory Architecture & Data Flow

Key Parameters & Controls

ROAS MultiplierDecimal Multiplier (x)

Gross advertising efficiency ratio (Gross Revenue divided by Ad Spend). A 3.50x ROAS indicates $3.50 in gross attributed sales generated for every $1.00 invested in paid media across ad auctions.

Default: 3.50x
Break-Even ROAS HurdleDecimal Multiplier (x)

The exact minimum ROAS multiplier required to yield exactly $0.00 in net accounting profit. Calculated as the reciprocal of pre-ad contribution margin ratio: 1 / [1 - (COGS% + Merchant Fee% + Shipping% + Return Drag%)]. Any campaign operating below this hurdle loses cash on unit economics.

Default: 2.14x
Target ROAS for ProfitabilityDecimal Multiplier (x)

The statutory campaign ROAS threshold necessary to achieve a predetermined net bottom-line profit margin (e.g., 15% or 20% Net Operating Margin). Calculated as: 1 / (Pre-Ad Contribution Margin Ratio - Target Net Margin Ratio).

Default: 3.15x
Maximum Allowable CPACurrency Amount ($)

The absolute ceiling an ad network can charge per customer acquisition before your net margin target is violated. Formula: AOV × (Pre-Ad Contribution Margin Ratio - Target Net Margin Ratio).

Default: $27.00
Required Storefront Conversion RatePercentage Ratio (%)

The minimum percentage of clicking visitors who must transact to sustain the Target CPA given prevailing auction click costs. Formula: (Target CPC / Maximum Allowable CPA) × 100.

Default: 4.63%
Marketing Efficiency Ratio (MER)Decimal Multiplier (x)

Blended business-level ratio of Total Gross Store Revenue divided by Total Combined Paid Media Outlay across all channels. Unlike platform-reported ROAS, MER is immune to multi-touch attribution double-counting and view-through inflation.

Default: 4.20x

Pro Tips & Best Practices

The Phantom Profit Trap: Platform In-App ROAS vs Net Contribution

Ad platforms (Meta, Google, TikTok) credit 100% of top-line order value to their tracking pixels using 7-day click or 1-day view attribution windows. If a product has a 35% COGS, 3% processing fee, $7 fulfillment shipping, and a 5% return rate, an ad manager showing a 2.0x ROAS is actually generating a net negative cash loss of -$0.12 per revenue dollar. Always calculate Break-Even ROAS using fully-loaded landed unit costs rather than factory wholesale costs alone.

AOV Expansion as the Primary Lever to Slash Break-Even Hurdles

Fixed costs like postage packaging and payment authorization gateway surcharges ($0.30 fixed fee + $6.00 parcel shipping) heavily penalize low-ticket orders. Increasing your Average Order Value from $40 to $80 through product bundles or post-purchase upsells cuts your fixed fulfillment overhead percentage in half, lowering your statutory Break-Even ROAS from 3.2x down to 2.1x without altering ad creatives.

Attribution Overlap and the 1.3x Omnichannel Cannibalization Rule

When running Meta prospecting campaigns concurrently with Google Brand Search and Retargeting, the sum of platform-reported revenues frequently exceeds actual bank deposits by 20% to 40% due to overlapping view-through and click-through attribution. Always benchmark against Blended MER (Storewide Revenue / Total Ad Spend). If platform ROAS increases while blended MER stagnates, your retargeting campaigns are simply claiming credit for organic shoppers.

The ROAS Decay Curve During Budget Scaling

As paid daily budgets scale from $500/day to $5,000/day, algorithmic audience saturation and rising auction CPMs inevitably cause marginal ROAS to compress. To protect net operating profit, establish an Escalated Scale Floor: accept a lower ROAS (e.g. dropping from 3.8x to 2.6x) only if absolute Net Contribution Dollars continue expanding, and halt budget increases the moment Marginal ROAS drops below the Break-Even ROAS hurdle.

Common Gotchas & Troubleshooting

⚠️Calculated Break-Even ROAS displays an impossible number or infinity error

This occurs mathematically when total variable deductions (COGS % + Payment Processing % + Fulfillment Shipping expressed as a percentage of AOV + Return Rate %) equal or exceed 100% of order value. When pre-ad contribution margin is zero or negative, no amount of advertising efficiency can generate a profit. You must raise retail pricing, renegotiate supplier COGS, or implement a minimum order threshold to establish a positive pre-ad margin.

⚠️High in-platform ROAS reported on Google or Meta, but business bank balances are draining

Audit three hidden cash drains immediately: (1) Delayed customer returns and chargebacks not feeding back into the ad pixel, (2) Attribution window overstatement (e.g. 1-day view attribution claiming credit for customers already converting via email newsletters), and (3) Unaccounted sales tax or VAT included in reported gross pixel revenue. Switch reporting to 7-day click-only attribution and verify net cash receipts against merchant payout batches.

⚠️Target ROAS exceeds realistic commercial benchmarks (> 5.0x for cold traffic)

When your required Target ROAS exceeds 5.0x for cold paid media, your gross margins are too thin to absorb paid acquisition friction. Transition from single-item acquisition to multi-unit bundles, introduce higher-margin recurring subscriptions, or shift paid traffic to high-ticket lead generation funnels where customer lifetime value (LTV) supports higher initial acquisition costs.

⚠️Conversion rate required to hit target CPA is higher than industry standard (> 5%)

If the mathematical conversion rate needed to support your target CPA exceeds 4-5% against standard CPCs, your acquisition funnel faces an efficiency deficit. Either lower your traffic acquisition cost by optimizing click-through rates (improving ad quality scores to discount CPCs) or increase your Average Order Value so that each individual conversion yields greater gross margin dollars.

Frequently Asked Questions

How do you calculate break-even ROAS with shipping and payment fees?▼

Break-Even ROAS is calculated by dividing 1 by your Pre-Ad Net Contribution Margin Ratio: Break-Even ROAS = 1 / [1 - (COGS% + Payment Gateway Fee% + (Shipping Cost per Order / AOV) + Return Rate%)]. For example, if a store has 30% COGS, 3% payment fees, $6 shipping on an $80 AOV (7.5%), and 4.5% returns, the pre-ad contribution margin is 55% (0.55). The Break-Even ROAS is 1 / 0.55 = 1.82x. Any campaign generating over 1.82x ROAS generates net profit.

What is considered a good ROAS for eCommerce ad campaigns?▼

A good ROAS typically ranges between 2.8x and 4.0x for direct-to-consumer eCommerce, but the true benchmark depends entirely on your product gross margin. A brand with 80% gross margins (such as apparel or software) can be highly profitable at a 2.0x ROAS, whereas a low-margin consumer electronics retailer with 20% gross margins will lose substantial money at a 3.5x ROAS and requires a 5.5x+ ROAS to survive.

What is the difference between ROAS and MER (Marketing Efficiency Ratio)?▼

ROAS (Return on Ad Spend) measures revenue directly attributed to a specific ad campaign, ad set, or channel divided by that channel's ad spend, making it subject to attribution discrepancies and platform bias. MER (Marketing Efficiency Ratio, or Blended ROAS) measures total storewide revenue across all sources divided by total combined marketing spend across all channels, providing an uncheatable macroeconomic view of overall business capital efficiency.

Why is my ad campaign profitable on Facebook Ads Manager but losing money in Shopify?▼

Disclaimer: This tool is provided strictly for educational and informational purposes only and does not constitute formal financial advice or a binding loan commitment. Please consult a qualified financial advisor before making decisions. Facebook Ads Manager reports gross revenue before deducting product manufacturing costs, merchant payment gateway fees, carrier shipping postage, and customer refunds, while also counting view-through conversions and overlapping with Google Ads attribution. Shopify's profit reports reflect actual net banking receipts after COGS and operational deductions, revealing that campaigns with apparently healthy 2.2x platform ROAS may sit below the true 2.6x cash break-even hurdle.

Related Tools & Utilities

All Tools →