Car Depreciation & Resale Value Calculator

Car Depreciation & Resale Value Calculator

Lbl regional regime

Calculate car depreciation and vehicle resale value by year and mileage. Estimate 5-year depreciation curves, residual trade-in equity, and true cost to own.

Lbl quick presets

Title capital basis

US ($)
$38,000
$
18% Lbl year1 drop short

Hint new retail drop

5 Unit years
12,000 Unit miles/Unit years short
Lbl benchmark dist 12,000
Lbl high order economics
7%
2.5%
$650

Title loan financing

$
%
Lbl est monthly payment$636 /Unit months short

Title reverse solver

Hint reverse solver intro

Kpi resale value
$21,36856.2% Lbl retained
Kpi capital loss
-$16,632-43.8% Lbl drop
Kpi annual cost
$3,326$277/Unit months short
Kpi net equity
$21,368Badge positive equity
Legend car valueLegend loan balance
Lbl hover point hint
$0$9,975$19,950$29,925$39,900Chart year0Chart year prefix 1Chart year prefix 2Chart year prefix 3Chart year prefix 4Chart year prefix 5

Title cfa insights

Insight retail drop titleInsight retail drop desc

Insight loan risk titleInsight equity healthy

Insight mileage tax titleInsight low mileage credit

Primary Metric56.2%
Efficiency / Capacity$9 /Unit days
Net OutputLbl positive equity profile

Client-Side Processing

High-performance calculation executed entirely in browser memory.

Zero Server Upload Privacy

All payloads remain strictly local with zero external server communication.

Production Ready Export

Clean, optimized output formats ready for immediate deployment.

Disclaimer titleDisclaimer text
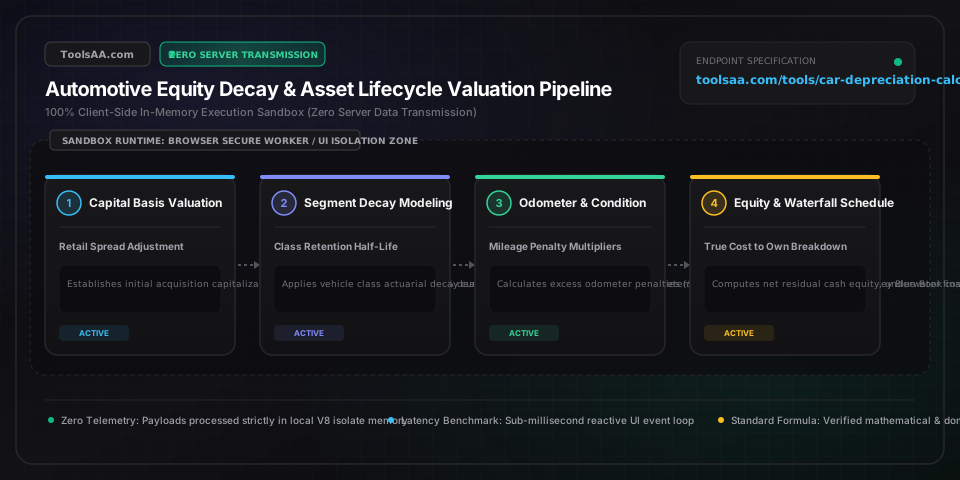
Technical Reference & Architecture Guide

Car Depreciation & Resale Value Calculator Guide

Calculate car depreciation and vehicle resale value by year and mileage. Estimate 5-year depreciation curves, residual trade-in equity, and true cost to own.

Car Depreciation & Resale Value Calculator Guide — Client-Side In-Memory Architecture & Data Flow

Key Parameters & Controls

vehicle_capitalized_cost_basisMonetary Currency ($ / £ / € / ¥)

The gross negotiated vehicle purchase price prior to statutory sales tax, title registration, dealer documentation fees, or trade-in equity allowances; serves as the unamortized starting cost basis.

Default: $38,000
acquisition_vehicle_chronological_ageElapsed Vehicle Age (0 to 10 Years)

Vehicle age at transaction date; new inventory incurs an immediate 15% to 25% year-one retail-to-wholesale haircut, whereas 3-year off-lease units transition into a stabilized 9% to 12% annual depreciation slope.

Default: 0 Years (Brand New)
projected_ownership_horizonHolding Period Duration (1 to 10 Years)

The planned capital holding period; amortizing vehicle ownership across 5 to 7 years mitigates steep front-loaded depreciation curves, reducing annualized ownership costs relative to 2-year trade-in cycles.

Default: 5 Years
annual_odometer_accumulationDistance Traveled (Miles or Kilometers / Year)

Annual operational mileage relative to actuarial benchmarks (12,000 miles/yr in the US, 15,000 km/yr in EU); variance past benchmark thresholds triggers non-linear residual penalties of $0.08 to $0.14 per mile.

Default: 12,000 miles/yr
vehicle_segment_retention_tierAutomotive Segment Classification

Architectural segment categorization; full-size body-on-frame trucks and compact crossover SUVs retain 55% to 65% residual value at Year 5, whereas executive luxury sedans and early-gen EVs retain only 35% to 40%.

Default: Compact Crossover SUV
vehicle_condition_grading_tierCosmetic & Mechanical Inspection Grade

Disposal condition rating based on NADA/KBB wholesale auction criteria: Excellent (+5% premium, top 3% percentile), Very Good (standard clean private party sale), Good (-8% wholesale baseline), Fair (-18% mechanical reconditioning deduction).

Default: Very Good

Pro Tips & Best Practices

The Driving Off the Lot Retail-to-Wholesale Spread Illusion

A new vehicle loses 10% to 15% of capitalized cost the moment title transfers, driven by the structural spread between retail pricing (including dealer overhead, advertising fees, and sales margin) and Manheim wholesale auction value. Trade-in valuation reflects wholesale bid price, making month one the steepest capital decay period of ownership.

The 3-Year Off-Lease Sweet Spot Arbitrage

Acquiring a 3-year-old off-lease or Certified Pre-Owned (CPO) vehicle exploits structural market asymmetry: the initial lessee absorbs the steepest 35% to 45% depreciation hit, allowing the secondary buyer to acquire the asset as annual depreciation flattens to 9% to 11% while retaining remaining powertrain warranty coverage.

Excess Mileage Penalty Multiplier

Odometer depreciation accelerates non-linearly around critical warranty and service thresholds: 36,000 miles (bumper-to-bumper expiration), 60,000 miles (powertrain expiration), and 100,000 miles (major overhaul cliff). Exceeding 12,000 annual miles destroys an incremental $500 to $700 per 5,000 miles ($0.10 to $0.14 per mile).

The Negative Equity Underwater Loan Trap

Financing a vehicle via 72-month or 84-month terms with under 10% down equity mathematically creates negative equity (underwater loan balance) for 36 to 48 months. Because automotive depreciation is front-loaded parabolic while amortized loan principal reduction is back-loaded, any early trade-in or collision loss creates severe out-of-pocket exposure without GAP insurance.

Common Gotchas & Troubleshooting

⚠️Dealer trade-in offer is 15% to 25% lower than published book value

Retail consumer valuation guides (KBB Private Party, Edmunds) aggregate retail transacted prices, whereas dealer trade-in offers are pegged to MMR (Manheim Market Report) wholesale auction bids minus $1,000 to $1,800 in safety reconditioning and dealership margin. To capture this spread, market the vehicle directly via private party sale or secure competing bids from algorithmic online cash buyers.

⚠️Electric Vehicle residual value dropped significantly faster than estimated

Electric vehicles experience accelerated residual obsolescence due to rapid lithium-ion energy density gains, charging protocol transitions, and OEM retail price cuts. To insulate personal equity against EV residual risk, structure acquisition through subsidized closed-end leases where captive finance institutions assume residual asset risk, or extend holding horizons past 8 years to fully amortize the battery pack life cycle.

Frequently Asked Questions

How much does a car depreciate per year on average?▼

A new car depreciates approximately 20% in year one (inclusive of an immediate 10% wholesale haircut upon titling), followed by 15% annually in years two through four, and stabilizes at 10% per year thereafter. By year five, a standard passenger vehicle retains roughly 40% of its capitalized sticker price, incurring a 60% cumulative capital loss.

What is the 5-year depreciation rule for new cars?▼

The 5-year car depreciation rule states that a brand-new vehicle loses approximately 60% of its initial capitalized purchase price over a 60-month ownership cycle under standard actuarial driving conditions (12,000 to 15,000 miles annually). Consequently, a $40,000 vehicle will hold an estimated residual resale value of approximately $16,000 at the end of five years.

Which cars hold their value best and depreciate the slowest?▼

Midsize and full-size body-on-frame pickup trucks (Toyota Tacoma, Ford F-150), rugged ladder-frame utility vehicles (Jeep Wrangler, Toyota 4Runner), and benchmark sports cars (Porsche 911) exhibit superior value retention, holding 60% to 70% of MSRP after 5 years. Conversely, flagship executive luxury sedans (BMW 7 Series, Mercedes-Benz S-Class) and first-generation EVs exhibit the steepest depreciation, retaining only 30% to 38%.

How do you calculate car depreciation per mile?▼

Car depreciation per mile is calculated using the formula: Depreciation Per Mile = (Capitalized Purchase Price - Net Resale Value) / Cumulative Miles Driven. For example, a vehicle purchased for $36,000 and liquidated for $18,000 after 60,000 total miles accrued $18,000 in total capital loss, yielding a precise depreciation cost of $0.30 per mile driven.

Does buying a 3-year-old used car save more money than buying new?▼

Disclaimer: This tool is provided strictly for educational and informational purposes only and does not constitute formal financial advice or a binding loan commitment. Please consult a qualified financial advisor before making decisions. Yes, purchasing a 3-year-old off-lease vehicle saves between 35% and 45% compared to purchasing brand new because the primary lessee absorbs the steepest front-loaded depreciation curve. As the secondary owner, your subsequent annual asset depreciation moderates to 9% to 11%, significantly lowering cumulative total cost of ownership (TCO) and insurance carrying costs.

Related Tools & Utilities

All Tools →