Short title

Solar Panel Payback & ROI Calculator

Calculate solar panel payback period, 25-year ROI, and net savings. Factor federal tax credits (ITC), loan financing, battery storage, NEM 3.0, and utility rate inflation.

Lbl regime
Presets label

Sec system sizing

8.0 Unit kw
2.0 Unit kw (Lbl compact)8.0 Unit kw (Lbl typical)25.0 Unit kw (Lbl estate)
$2.85Unit per watt

Hint gross cost $22,800

%
Hint section25 d
Hint direct incentives
Lbl net system costHint total tax benefit -$9,990
$23,310

Sec utility tariffs

Lbl annual $3,120
Hint per kwh retail
4.0%Unit per year
Lbl inflation lowLbl inflation midLbl inflation high
85.0%
Lbl self use solar onlyLbl self use batteryLbl self use off grid
$0.080Unit per kwh

Sec battery addon

Hint battery tax benefit

Sec financing mode

Sec engineering parameters

Hint solar irradiance
Hint derate desc
Hint degradation desc
Kpi simple payback
4.9 Unit yrs

Hint breakeven month 59

Kpi net savings
$147,400

632.3% Lbl total return

Kpi irr
22.1%

Lbl discounted npv $64,910

Kpi lcoe
$0.141

Lbl grid rate $0.380Unit per kwh

Title cash flow chart

Lbl zero breakevenLbl year prefix 0Lbl year prefix 5Lbl year prefix 10Lbl year prefix 15Lbl year prefix 20Lbl year prefix 25

Title reverse solver

7.0 Unit yrs
Lbl max allowable cost$4.85Unit per wattHint max quote
Lbl min required tariff$0.248Unit per kwhHint current tariff $0.380

Title carbon credentials

Lbl lifetime generation 315,716 Unit kwh

123.1 Unit metric tonsLbl co2 offset
~2,032Lbl trees planted

Disclaimer text

Stat simple payback4.9 Unit yrs
Stat25 yr profit$147,400
Stat roi632.3%
Stat lcoe$0.141Unit per kwh
Stat lifetime clean power315,716 Unit kwh
Stat co2 avoidance123.1 Unit metric tons
Technical Reference & Architecture Guide

Solar Panel Payback & ROI Calculator Guide

Calculate solar panel payback period, 25-year ROI, and net savings. Factor federal tax credits (ITC), loan financing, battery storage, NEM 3.0, and utility rate inflation.

Solar Panel Payback & ROI Calculator Guide — Client-Side In-Memory Architecture & Data Flow

Key Parameters & Controls

System Sizing & Nameplate Capacity (kW DC)Direct Current Electrical Capacity (kW)

The aggregate rated direct-current (DC) power output of all solar photovoltaic panels on the roof under Standard Test Conditions (STC: 1,000 W/m² irradiance, 25°C cell temperature). A typical residential solar installation ranges from 5.0 kW (12 to 14 panels) for moderate electricity consumers up to 12.0+ kW (30+ panels) for large households with central air conditioning, heat pumps, or electric vehicles.

Default: 8.0 kW (approx. 20 modern 400W monocrystalline silicon panels)
Turnkey Installation Cost per Watt ($/W)Unit Capital Expenditure ($ / Watt DC)

The all-inclusive gross contract price charged by a licensed solar installer per rated watt before applying any federal tax credits or state incentives. Comprises PV modules (15%-20%), inverters (10%-15%), racking and structural mounting (8%-10%), electrical balance of system, electrical engineering, municipal permitting, utility interconnection fees, and labor.

Default: $2.85 / Watt ($2.60 to $3.30/W national average range for cash purchases)
Federal Residential Clean Energy Credit (Section 25D ITC)Non-Refundable Federal Income Tax Credit (%)

The statutory federal tax credit enacted under the Inflation Reduction Act of 2022 (IRC Section 25D), allowing homeowners to deduct exactly 30% of total solar and qualifying battery storage system equipment and installation costs directly from their federal tax liability through 2032 (stepping down to 26% in 2033 and 22% in 2034).

Default: 30% (Standard statutory credit through December 31, 2032)
Daily Peak Sun Hours & System Derate FactorSolar Insolation (Hours/Day) & Conversion Efficiency (%)

Peak Sun Hours measures equivalent hours per day when solar irradiance averages 1,000 W/m² (ranging from 3.2 hrs/day in the cloudy Pacific Northwest or Northern Europe up to 5.8+ hrs/day in the Desert Southwest and Australia). The system derate factor (typically 80% to 86%) aggregates real-world losses from DC-to-AC inverter conversion, wiring resistance, ambient cell thermal heating, dust/soiling, and snow cover.

Default: 4.8 Peak Sun Hours / Day with an 85% (0.85) NREL PVWatts Derate Factor
Current Electricity Rate & Annual Utility Inflation RateUtility Tariff ($/kWh) & Annual Escalation (%)

The blended volumetric price per kilowatt-hour billed by your retail electric utility (comprising generation, transmission, distribution, and environmental riders), combined with projected annual tariff increases. According to the US Energy Information Administration (EIA), residential electricity prices historically inflate at a compound rate of 2.8% to 4.5% per year.

Default: $0.180 / kWh baseline rate with 3.5% annual utility rate inflation
Net Metering Tariff Policy & Self-Consumption RatioUtility Interconnection Tariff Framework & Usage (%)

Defines how exported solar electricity is credited by the utility. Under 1:1 Retail Net Metering (NEM 1.0/2.0), exports receive full retail credit. Under California NEM 3.0 (Net Billing Tariff) and similar avoided-cost structures, grid exports receive wholesale avoided-cost credits (~$0.05-$0.08/kWh), making on-site self-consumption via smart loads or battery storage vital to preserve financial ROI.

Default: NEM 1.0/2.0 Retail (or NEM 3.0 Net Billing with 45% Solar / 85% Battery Self-Consumption)
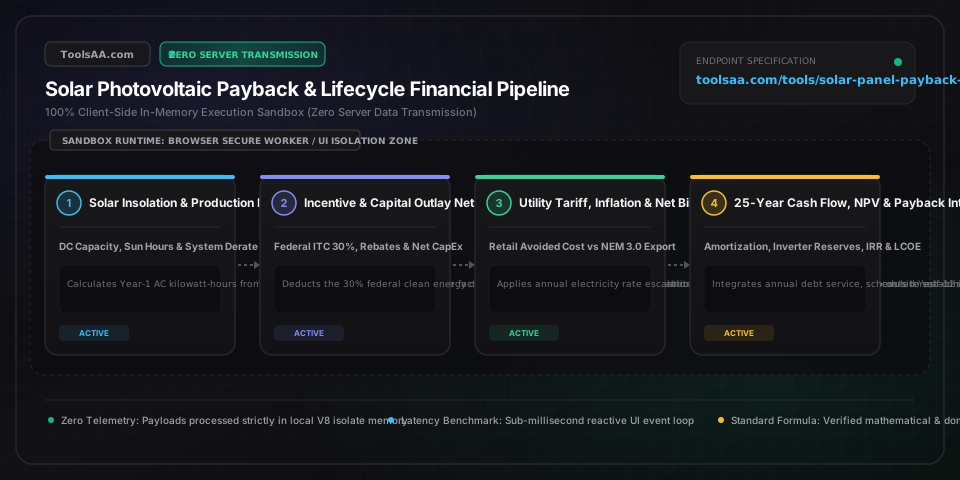
Pro Tips & Best Practices

The California NEM 3.0 Solar-Without-Battery Value Cliff

Under California NEM 3.0 (enacted April 2023 by the CPUC), grid export compensation dropped by approximately 75%—from retail rates (~$0.38/kWh) to avoided cost rates (~$0.08/kWh). Installing a solar-only array under NEM 3.0 where 55% of generation is exported to the grid extends your payback period from 5.5 years out to 9.8 years. Adding a 10 kWh lithium battery captures daytime solar for self-consumption during peak evening hours (4:00 PM to 9:00 PM), restoring payback to 6.5 to 7.0 years.

The Month-18 Solar Loan Balloon Re-Amortization Clause

Most 20- and 25-year solar loans advertised with ultra-low monthly payments include an 18-month re-amortization requirement. The lender assumes you will claim your 30% federal tax credit and pay 100% of that refund directly toward the loan principal by Month 18. If you keep the tax refund for other expenses, the loan re-amortizes at a much higher balance, increasing your monthly payment by 35% to 45% for the remaining term.

The Hidden Cost of Inverter Replacement at Year 12

While Tier-1 solar panels carry 25-year linear performance warranties (guaranteeing >=85% output at Year 25), central string inverters carry standard warranties of only 10 to 12 years. Factor in a scheduled string inverter replacement cost of $1,500 to $2,500 in Year 12 when projecting lifetime ROI. Alternatively, opt for microinverters (e.g., Enphase), which include 25-year manufacturer warranties matching the panel lifespan.

LCOE vs Utility Grid Rate as the Ultimate Inflation Hedge

Do not evaluate solar solely by the simple payback year; evaluate Levelized Cost of Electricity (LCOE). A properly sized residential solar array typically produces electricity at a fixed LCOE of $0.06 to $0.09 per kWh over 25 years. Comparing this against utility grid rates that escalate from $0.18/kWh today to $0.35+/kWh over 20 years proves that solar operates as an inflation-proof prepaid utility hedge.

Avoid the System Oversizing Penalty under Net Billing

Under 1:1 net metering, oversizing your system to 120% of annual usage allowed you to bank credits for future EV purchases. Under modern Net Billing Tariffs (NEM 3.0), surplus electricity exported beyond your annual consumption is cashed out at true wholesale market rates (often less than $0.03/kWh). Oversizing beyond 100%-105% of anticipated household demand dilutes project ROI and extends payback.

Common Gotchas & Troubleshooting

⚠️Installer Quote Payback Period is 3 to 4 Years Faster than Reality

Solar sales proposals frequently bake in aggressive 6% to 8% utility rate inflation, ignore the 0.5%/year panel output degradation, omit inverter replacement costs, and assume 100% full retail export credits in net-billing markets. Audit the proposal using realistic 3.0%-3.5% inflation, 85% derate factor, and actual utility net billing rules to see true breakeven timing.

⚠️Solar Loan Dealer Fees Inflating the Cash Turnkey Price by 20% to 35%

Solar loans advertising deceptively low interest rates (e.g. 2.99% or 4.99% when market rates are 7%) incorporate hidden 'dealer fees' of 20% to 35% added directly onto the financed principal. A system with a $20,000 cash price becomes a $26,000 loan balance. Always ask installers for the all-cash price versus the financed price, and consider third-party credit union home equity loans (HELOC) with zero dealer fees.

⚠️Inverter DC-to-AC Clipping Causing Apparent Power Loss on Sunny Midday Hours

If your 8.0 kW DC solar array is paired with a 6.6 kW AC inverter (a standard DC-to-AC ratio of 1.20 to 1.25), output will flatline at 6.6 kW during peak sunny spring afternoons. This is intentional engineering: sizing the inverter slightly smaller than peak DC array capacity lowers equipment costs and maximizes inverter efficiency during early morning, late afternoon, and overcast periods. Midday clipping losses are typically under 1.5% annually.

⚠️Roof Azimuth, Pitch, and Shading Severely Reducing Solar Insolation

If panels face East or West rather than true South (in the Northern Hemisphere), annual generation drops by 15% to 20%. A roof pitch steeper than 40 degrees or tree shading between 10:00 AM and 3:00 PM reduces solar harvest. Adjust the System Derate Factor down from 85% to 75%-78% to account for non-optimal orientation and micro-shading losses.

Frequently Asked Questions

How do you calculate the solar panel payback period?▼

To calculate the solar panel payback period, divide the net turnkey system cost by your annual electricity bill savings: Payback Period (Years) = Net System Cost / Year 1 Electric Bill Savings. Net System Cost equals the gross installation price minus the 30% federal clean energy tax credit (ITC) and any state or utility cash rebates. For example, if a 8 kW system costs $22,800 gross, claiming the 30% federal credit ($6,840) leaves a net cost of $15,960. If the system saves $2,280 in utility electricity charges in Year 1, the simple payback period is $15,960 / $2,280 = 7.0 years. More comprehensive models also incorporate annual utility rate inflation (2.5%-4.5%), panel degradation (0.5%/yr), and inverter replacement reserves.

What is an average or good payback period for residential solar panels?▼

A good residential solar panel payback period in the United States and internationally typically ranges between 6 and 9 years. In states with high retail electricity tariffs and abundant sunshine (such as California, Hawaii, Massachusetts, and Arizona), payback can occur in as little as 4.5 to 6.5 years. In regions with below-average utility rates ($0.11 to $0.13/kWh) or lower sun hours, payback periods typically range between 8.5 and 11 years. Given that modern monocrystalline Tier-1 solar panels carry 25-year performance warranties and operate for 30+ years, achieving payback in 7 years yields 18 to 23 years of virtually free clean electricity.

How does California NEM 3.0 affect solar panel payback and ROI?▼

California NEM 3.0 (the Net Billing Tariff effective April 2023) dramatically altered residential solar payback by reducing grid export credits by ~75%, from retail rates (~$0.38/kWh) down to wholesale avoided cost rates (~$0.05 to $0.08/kWh). For a standalone rooftop solar system without battery storage, approximately 50% of the energy produced during sunny midday hours is sent to the grid at these depressed export credits, pushing simple payback from ~5.5 years out to 9.5 to 11 years. However, when solar is paired with a battery storage system (such as a 10-13.5 kWh battery), the battery stores excess midday solar energy and discharges it during peak evening hours (4 PM to 9 PM). This restores on-site self-consumption to 85%-90%, bringing the combined system payback back down to 6.5 to 7.5 years.

Is it better to buy solar panels with cash or finance with a solar loan?▼

Buying solar panels with cash delivers the highest lifetime return on investment (ROI), shortest payback period, and highest cumulative 25-year net savings because you avoid loan interest charges and inflated installer dealer fees. A cash purchase typically yields an internal rate of return (IRR) of 12% to 18%. Financing with a solar loan allows you to go solar with zero money down, swapping your existing electric utility bill for a monthly loan payment. While a solar loan provides immediate day-one monthly cash flow savings, total 25-year net profit is 30% to 50% lower due to cumulative interest payments and potential 15% to 30% hidden upfront loan dealer fees.

How does adding a battery storage system impact solar payback time?▼

Adding a residential battery storage system (typically $10,000 to $14,000 for a 10 to 13.5 kWh unit before the 30% federal tax credit) generally adds 1.0 to 2.5 years to the overall system payback period under full 1:1 retail net metering (NEM 1.0/2.0). However, in markets with Time-of-Use (TOU) rate plans or Net Billing Tariffs like California NEM 3.0, a battery actually shortens or preserves project payback by preventing cheap midday export and shifting consumption away from peak utility rates ($0.45+/kWh). Additionally, a battery qualifies for the full 30% federal tax credit (saving $3,000 to $4,200) and provides invaluable backup resilience during grid blackouts.

What happens to solar savings when the inverter needs replacement?▼

Disclaimer: This tool is provided strictly for educational and informational purposes only and does not constitute formal financial advice or a binding loan commitment. Please consult a qualified financial advisor before making decisions. Solar panels generally last 25 to 35 years, but central string inverters typically have a lifespan of 10 to 15 years and must be replaced once during the system's operational lifetime. A replacement string inverter costs approximately $1,500 to $2,500 including labor. This planned capital expense briefly creates a negative annual net cash flow in Year 11 to 14, extending the overall simple payback timeline by roughly 0.6 to 1.0 year. Alternatively, homeowners who install microinverters (e.g. Enphase) or DC optimizers with 25-year manufacturer warranties avoid this midpoint replacement cost entirely, though microinverter systems carry a higher upfront equipment price tag.

Related Tools & Utilities

All Tools →