/
EV Charging Time & Cost Calculator
Badge electro chemical•Badge client privacy

EV Charging Time & Cost Calculator

Calculate electric vehicle charging time, electricity cost, and added range across Level 1, Level 2, and DC fast chargers. Features 80% taper curve, AC OBC bottlenecking, and gas savings parity.

Lbl regional regime
Lbl quick presets

Title vehicle settings

Unit kwh
Unit kw
Lbl soc progression20% ➔ 80% (+60%)
Lbl start soc20%
Lbl target soc80%
$/Unit kwh
$
mi/kWh
$/gal
Kpi total duration
6Unit hours short 30Unit minutes short
20% ➔ 80%
Kpi total cost
$8.00
50.0 Hint kwh from grid
Kpi added range
+158 mi
~24 miHint speed per hr
Kpi gas savings
$10.38
Hint vs gas cost prefix $18.38 Hint vs gas cost suffix
Title battery gauge
45.0 Hint kwh into pack
20%
+60%
0%25%50%80% (Lbl taper point)100%
Lbl time to80 text 6Unit hours short 30Unit minutes short
Lbl above80 text 0Unit minutes short

Title technical specs

Spec nominal power7.7 Unit kw
Spec effective peak power6.9 Unit kw
Spec net energy45.00 Unit kwh
Spec gross drawn50.00 Unit kwh(-10% Unit loss)
Spec cost per distance mi$5.08
Spec gas equiv cost mi$11.67
Tip driver advice title Tip ac commute advice
Technical Reference & Architecture Guide

EV Charging Time & Cost Calculator Guide

Calculate electric vehicle charging time, electricity cost, and added range across Level 1, Level 2, and DC fast chargers. Features 80% taper curve, AC OBC bottlenecking, and gas savings parity.

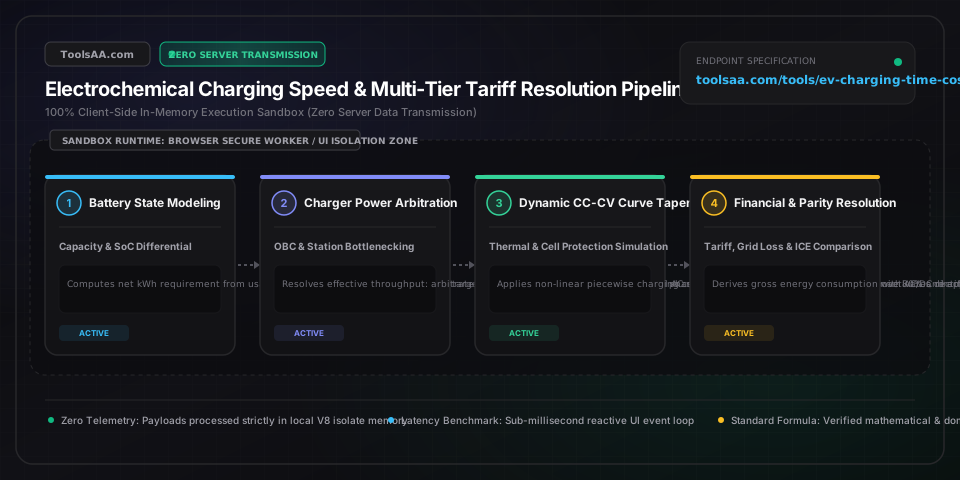
EV Charging Time & Cost Calculator Guide — Client-Side In-Memory Architecture & Data Flow

Key Parameters & Controls

Usable Battery Capacity (kWh)Energy Storage Capacity (Kilowatt-Hours / kWh)

The actual net electrical energy stored in the battery pack available for driving range, strictly excluding upper and lower protective safety buffers (typically 3% to 8% of total gross pack capacity) engineered by vehicle manufacturers to prevent irreversible cell degradation and thermal runaway.

Default: 75.0 kWh (Standard Long-Range EV)
Target State of Charge (SoC) WindowCharge Level Interval Percentage (% to %)

The starting and intended ending battery percentage. Daily home charging is recommended between 20% and 80% to preserve lithium nickel manganese cobalt (NMC) health, whereas road-trip DC fast charging delivers peak efficiency between 10% and 80% before aggressive charging taper profiles kick in.

Default: 20% to 80% (Daily Commute Window)
Charging Station Output Power (kW)Supply Power Delivery Rate (Kilowatts / kW)

The maximum instantaneous electrical delivery rate of the external charging hardware: standard Level 1 wall plugs supply 1.4 to 1.9 kW; dedicated Level 2 home wallboxes supply 7.2 to 11.5 kW; commercial Level 3 DC fast charging stalls supply 50 kW to 350 kW.

Default: 7.7 kW (240V / 32A Level 2 Wallbox)
On-Board Charger (OBC) AC Capacity (kW)Internal Rectifier Speed Ceiling (Kilowatts / kW)

The vehicle's internal hardware inverter limit that converts grid alternating current (AC) into battery direct current (DC). Even if plugged into a 19.2 kW Level 2 power source, a vehicle equipped with a standard 11.0 kW or 7.7 kW OBC will strictly cap energy intake at its built-in hardware ceiling.

Default: 11.0 kW (Typical Modern 3-Phase / 48A Ceiling)
Grid-to-Battery System Efficiency (%)Energy Transfer Efficiency Percentage (%)

The total electrical round-trip transfer efficiency after factoring in heat dissipation, active cabin/battery liquid cooling pumps, and AC-to-DC rectification loss (averaging 85% to 90% on home AC circuits and 92% to 96% on direct high-voltage DC fast stations).

Default: 90% (Standard AC Wallbox Efficiency)
Electricity Tariff Rate ($/kWh)Energy Cost per Unit (Currency / kWh)

The utility tariff per kilowatt-hour drawn from the electrical grid, spanning typical domestic night super-off-peak rates ($0.05 to $0.12/kWh), standard residential averages ($0.16 to $0.28/kWh), and on-peak public DC fast chargers ($0.40 to $0.56/kWh).

Default: $0.16 / kWh (US Residential Average)
Baseline Gasoline Fuel Economy (MPG)Comparative Combustion Efficiency (Miles per Gallon)

The fuel economy of a comparable internal combustion engine (ICE) vehicle used to calculate real-world operating cost parity, fuel cost displacement, and net household cash savings per 100 miles driven.

Default: 30.0 MPG ($3.50/gal Benchmark)
Pro Tips & Best Practices

The 80% Fast-Charging Rule of Thumb

On long-distance road trips, always unplug your vehicle at 80% State of Charge (SoC). Charging lithium-ion cells from 80% to 100% can take as long as charging from 10% to 80% because the onboard battery management system dramatically throttles incoming amperage to prevent thermal overheating and lithium dendrite plating. Unplugging at 80% and driving to the next charger saves 25 to 40 minutes per travel leg.

Preconditioning in Cold Winter Temperatures

Cold lithium chemistry drastically increases internal battery impedance, which can slash DC fast-charge speeds by 40% to 60% on sub-freezing days. Always activate in-vehicle satellite navigation to your destination charging hub 20 to 30 minutes prior to arrival. This automatically engages the vehicle's thermal heat pump to warm the pack into its optimal 25°C to 35°C (77°F to 95°F) acceptance window before you plug in.

Home Utility Time-of-Use (TOU) EV Tariffs

Enrolling in a dedicated Time-of-Use (TOU) or electric vehicle overnight schedule can reduce home charging costs from daytime peak rates of $0.28-$0.45/kWh down to super-off-peak rates of $0.05-$0.09/kWh (typically between 12:00 AM and 6:00 AM). Over an average driving schedule of 12,000 miles per year, automated overnight scheduling saves families between $800 and $1,400 annually.

The 80% Continuous Circuit Safety Rule (NEC 80%)

National Electrical Code (NEC Article 625) mandates that continuous electrical loads running longer than 3 hours cannot exceed 80% of the circuit breaker's maximum rated capacity. For example, a 50-ampere dedicated breaker safely sustains a continuous 40-amp charging rate (9.6 kW), while running a 48-amp charger (11.5 kW) requires a hardwired connection on a dedicated 60-amp circuit breaker to prevent breaker trips and fire hazards.

Lithium Iron Phosphate (LFP) vs NMC Battery Chemistry Habits

Identify your vehicle's specific cell chemistry: Nickel Manganese Cobalt (NMC) packs suffer elevated mechanical stress when stored near full capacity and should be kept between 20% and 80% for daily errands. In contrast, Lithium Iron Phosphate (LFP) batteries exhibit exceptionally flat voltage curves and resist degradation at high voltages; manufacturers recommend charging LFP packs to 100% at least once weekly to calibrate the battery management system's internal voltage estimator.

Common Gotchas & Troubleshooting

⚠️Charging speed is drastically lower than the station advertised rating (e.g. 45 kW at a 150 kW DC charger)

Verify three primary bottlenecks: First, check your current battery level; charging rates taper severely once battery SoC exceeds 60% to 70%. Second, verify battery temperature; an unconditioned cold pack limits intake to protect cell membranes. Third, check whether the charging pedestal shares a shared cabinet with an adjacent vehicle (power-splitting), or if your vehicle operates on a 400V architecture connected to a station that only reaches its maximum kilowatt rating on 800V vehicles.

⚠️Level 2 home breaker trips after 45 to 60 minutes of uninterrupted charging

A delayed breaker trip indicates thermal accumulation rather than an instantaneous short circuit. Confirm that your wallbox charging current conforms to the NEC 80% continuous load rule (e.g., maximum 32A continuous load on a 40A breaker, or 40A load on a 50A breaker). Next, have a licensed electrician check that terminal lugs and screw terminals inside the electrical panel and NEMA 14-50 outlet are torqued precisely to manufacturer inch-pound specifications, as loose connections generate dangerous resistive heat under sustained loads.

⚠️Public DC fast charging station fails handshake and displays communication error

Heavy combined CCS or NACS charging cables exert downward physical leverage on the vehicle charging port, causing microscopic pin misalignment during initial digital safety handshakes. Gently support and push the heavy charging connector upward and flush into the port for 10 to 15 seconds until the physical locking pin engages and audible contactors click. If the issue persists, inspect the port for dirt or debris and perform an infotainment system reboot.

⚠️Significant discrepancy between kWh billed on utility statement and kWh received by vehicle battery

Electricity meters measure gross electrical energy delivered from the breaker, while the in-car display reports net energy stored in the chemical cells. The 10% to 18% difference reflects normal thermodynamic conversion realities: alternating current (AC) must be converted into direct current (DC) by the vehicle's onboard rectifier, while active thermal management loops continuously circulate cooling liquid and run radiator fans during high-amperage charging sessions.

Frequently Asked Questions

How do you calculate EV charging time and cost?▼

To calculate charging time in hours, divide the required battery energy (Usable Capacity in kWh multiplied by the percentage increase needed) by the effective charging power in kW, then divide by charging efficiency (typically 0.90 for AC or 0.95 for DC): Time (hours) = [Battery kWh × (Target % - Start %)] / (Charger kW × Efficiency). To calculate charging cost, multiply the total gross kilowatt-hours drawn from the wall by your electricity rate: Cost = [Net Battery kWh Added / Efficiency] × Electricity Rate ($/kWh), adding any public station flat session fees or idle surcharges.

Why does DC fast charging slow down dramatically above 80% state of charge?▼

DC fast charging slows down because lithium-ion batteries follow a two-phase Constant Current / Constant Voltage (CC/CV) charging curve to safeguard internal chemistry. Below 80% State of Charge, cells absorb high continuous current with minimal internal resistance. As charge level nears 80%, cell voltage reaches its chemical ceiling (~4.2 volts per cell), forcing the battery management system to ramp down current to prevent lithium metal plating, excessive internal heat build-up, and accelerated cell degradation.

How much does it cost to fully charge an electric car at home versus a public station?▼

Replenishing a standard 75 kWh EV battery from 20% to 80% (requiring approximately 50 kWh gross grid power) at home at the US national residential average of $0.16/kWh costs approximately $8.00, or as little as $3.50 to $4.50 on super-off-peak time-of-use utility rates. In contrast, charging the identical 50 kWh at a commercial public Level 3 DC fast charger ($0.42 to $0.52/kWh) typically costs between $21.00 and $26.00, making home charging 60% to 80% cheaper than commercial fast charging.

How do temperature and winter weather affect EV charging speed and efficiency?▼

Sub-freezing temperatures increase battery electrolyte viscosity and internal cell resistance, cutting DC fast charging intake speeds by 30% to 50% until the battery reaches its optimal 25°C to 35°C (77°F to 95°F) window. Concurrently, winter cabin climate control and battery resistance increase driving energy consumption by 15% to 30%, which requires approximately 20% to 35% more kilowatt-hours to cover the same driving distance compared to moderate 20°C (68°F) weather.

How do Level 1, Level 2, and Level 3 DC fast chargers differ in speed and voltage?▼

Level 1 chargers utilize standard 120-volt AC household outlets delivering 1.4 kW to 1.9 kW, replenishing 3 to 5 miles of driving range per hour (ideal for plug-in hybrids or low-mileage commuters). Level 2 chargers operate on 240-volt single-phase AC circuits (or 400V 3-phase in Europe) delivering 3.8 kW to 19.2 kW, replenishing 18 to 45 miles of range per hour (the standard for residential and workplace overnight charging). Level 3 DC fast chargers bypass the vehicle's onboard converter with 400-volt to 800-volt direct current delivering 50 kW to 350 kW, replenishing 100 to 250 miles in 15 to 30 minutes.

Does frequent DC fast charging damage or degrade an EV battery over time?▼

Frequent DC fast charging causes a modest 1% to 3% additional capacity degradation over a 5-year, 60,000-mile ownership period compared to exclusive Level 2 home charging, according to comprehensive telematics fleet studies. Modern liquid-cooled battery thermal management systems actively prevent excessive heat build-up during fast charging, keeping cumulative degradation minimal provided drivers avoid routinely charging past 80% or letting the vehicle sit fully charged in extreme heat.

Related Tools & Utilities

All Tools →