Short title

Road Trip Gas Cost Splitter & Fuel Calculator

Split road trip gas costs, fuel expenses, and highway tolls fairly among passengers. Calculate mileage, car wear allowances, and unequal leg splits instantly.

Lbl per person share4 Lbl equal
$34.54

Lbl driver: $34.54

Lbl total trip cost
$138.18
$0.20 / Unit per mile
Lbl total fuel cost$113.18
Lbl fuel volume33.3 gallons
Lbl tolls share$25.00
Lbl wear share$0.00
Lbl cost breakdown100% Lbl total share
Lbl per person share$34.54
Lbl fuel share: 82%
Lbl tolls share: 18%
Lbl wear share: 0%
Lbl speed drag impact65 mph (105 km/h)
+$9.05Lbl drag penalty
Lbl effective efficiency: 22.1 MPGLbl aero formula tip
Efficiency / Capacity: $138.18Net Output: $34.54
Disclaimer title

Disclaimer text

Stat total distance700 miles
Stat total volume33.3 gallons
Stat per mile unit$0.20 / Unit per mile
Client-Side Processing

High-performance calculation executed entirely in browser memory.

Zero Server Upload Privacy

All payloads remain strictly local with zero external server communication.

Production Ready Export

Clean, optimized output formats ready for immediate deployment.

Technical Reference & Architecture Guide

Road Trip Gas Cost Splitter & Fuel Calculator Guide

Split road trip gas costs, fuel expenses, and highway tolls fairly among passengers. Calculate mileage, car wear allowances, and unequal leg splits instantly.

Road Trip Gas Cost Splitter & Fuel Calculator Guide — Client-Side In-Memory Architecture & Data Flow

Key Parameters & Controls

One-Way or Round-Trip Route DistanceGeographic Trajectory (Miles / Kilometers)

The total transit distance navigated during the road trip. Round-trip journeys double the odometer reading, fuel consumption volume, and distance-based maintenance amortization while sharing single-instance parking and permit fees.

Default: 350 Miles (Round-Trip)
Vehicle Fuel Economy & EPA RatingFuel Consumption Efficiency (MPG / L/100km / km/L)

Vehicle fuel efficiency under typical highway conditions. Common real-world baselines include 45-52 MPG (4.5-5.2 L/100km) for compact hybrids, 30-36 MPG (6.5-7.8 L/100km) for compact sedans, 22-28 MPG (8.4-10.7 L/100km) for crossovers, and 16-20 MPG (11.8-14.7 L/100km) for full-size SUVs and loaded minivans.

Default: 26.0 MPG (9.0 L/100km)
Retail Pump Fuel PriceRetail Liquid Fuel Cost ($/gal, €/L, £/L, ¥/L)

Average retail price paid at gasoline or diesel filling stations along the travel corridor. Fuel prices often surge by 15% to 30% along rural highway exits, remote national park approaches, and cross-state borders compared to metropolitan transit centers.

Default: $3.45 / gallon
Traveler Headcount & Passenger PoolPassenger Headcount (1 to 12 Travelers)

Total headcount of individuals occupying seats in the vehicle. Increasing passenger count produces dramatic economies of scale: adding a second passenger halves fuel costs per person (-50%), a third cuts it by 66.7%, and a fourth reduces per-person fuel obligations by 75% relative to solo driving.

Default: 4 Passengers
Highway Tolls, Bridges & Destination PassesFixed Communal Roadway Charges (Currency)

Cumulative outlays for electronic turnpikes, transponder toll plazas, suspension bridges, congestion zones, and national/state park vehicle entry fees. These charges are fixed communal overhead divided equally among traveling passengers.

Default: $25.00
Vehicle Wear & Tear Depreciation AllowanceAutomotive Maintenance Surcharge ($/mi or €/km)

An optional per-mile or per-kilometer allowance ($0.05 to $0.15/mile) reimbursed to the car owner to offset engine oil shear, tire tread degradation, brake pad friction, and post-trip detailing. The IRS business mileage deduction rate sets this comprehensive vehicle operational ceiling at $0.67 per mile.

Default: $0.00 / mile (Optional)
Driver Fuel Exemption ProtocolEquitable Carpool Policy (Toggle)

A widely observed road trip etiquette option where the car owner or primary driver does not pay for fuel or tolls. In this configuration, the vehicle owner contributes their car and driving labor, while the remaining non-driving passengers split 100% of the gas and toll outlays equally.

Default: Driver Included (Equal Split)
Cruising Speed & Aerodynamic Velocity DragAerodynamic Velocity Drag Modifier (mph / km/h)

Highway cruising speed tier. Because aerodynamic wind resistance scales quadratically with speed, cruising at 75 mph (120 km/h) consumes approximately 20% more fuel than cruising at 55 mph (88 km/h). Selecting higher cruising speeds automatically penalizes effective MPG to match real-world highway fuel burn.

Default: 65 mph (Standard Highway)
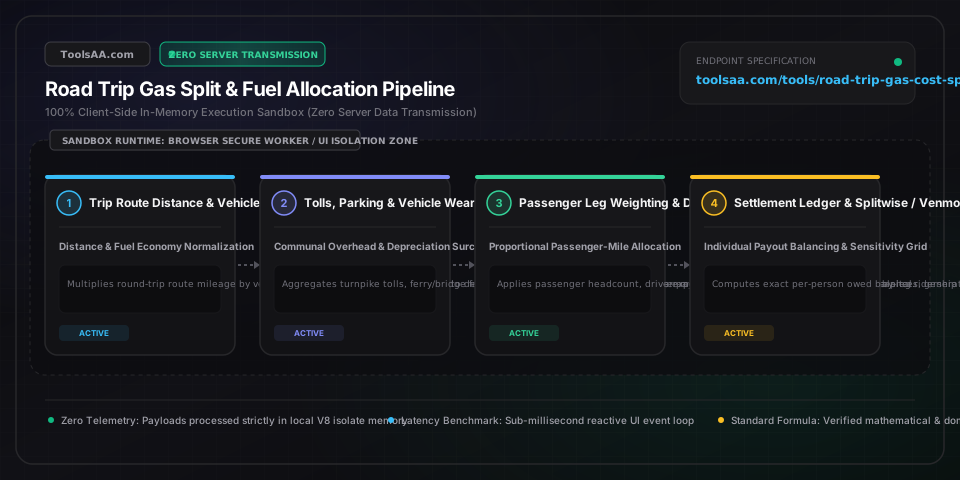
Pro Tips & Best Practices

The Aerodynamic Velocity Drag Speed Cliff (55 mph vs 75+ mph)

Fuel economy peaks between 45 and 55 mph for virtually all gasoline and hybrid passenger vehicles. According to extensive Oak Ridge National Laboratory and EPA wind-tunnel tests, aerodynamic drag increases with the square of vehicle velocity. Driving 75 mph consumes 18% to 22% more fuel than cruising at 60 mph, while pushing to 80 mph imposes a 28% fuel penalty. On an 800-mile road trip, driving at 65 mph instead of 80 mph saves between $25 and $45 in fuel while adding less than 75 minutes of total driving time.

The Car Owner Wear and Tear Blind Spot

Fuel represents less than 45% of the true cost of operating a motor vehicle on long-distance road trips. According to annual AAA Driving Costs studies, tire wear, synthetic motor oil breakdown, brake wear, and mileage depreciation add $0.18 to $0.28 per mile of true vehicle wear. If a car owner drives 1,500 miles and only splits gas, they absorb over $300 in unseen vehicle depreciation. For trips exceeding 500 miles, agreeable groups should allocate a modest $0.05 to $0.08 per mile wear-and-tear buffer to the vehicle host.

Roof Racks and Cargo Carrier Aerodynamic Drag Penalties

Mounting a rooftop cargo box, ski rack, or exterior bicycle carrier dramatically disrupts laminar airflow over your vehicle. Wind-tunnel testing conducted by Consumer Reports and the Society of Automotive Engineers (SAE) demonstrates that an empty roof rack reduces fuel economy by 5% to 11% at highway speeds, while a loaded rooftop cargo box degrades MPG by 19% to 25%. For maximum fuel savings, use aerodynamic rear hitch-mounted cargo boxes instead, which sit in the vehicle's low-pressure slipstream and incur under 2% fuel penalty.

Air Conditioning vs Open Windows at Highway Speeds

A common road trip debate is whether running air conditioning burns more fuel than rolling down the windows. Below 45 mph (72 km/h), vehicle aerodynamic drag is low, making open windows more fuel-efficient than running the engine-driven AC compressor. However, above 55 mph (88 km/h), open windows create substantial aerodynamic turbulence and vehicle drag that consumes significantly more fuel than a modern, closed-cabin air conditioning system operating at a steady thermostat setting.

Common Gotchas & Troubleshooting

⚠️Actual Gas Expense Consistently Outpacing Pre-Trip Calculator Estimates

This discrepancy occurs when pre-trip calculations rely on EPA highway window-sticker ratings without adjusting for real-world driving conditions. Highway EPA tests assume steady 48 mph average speeds with no cargo weight. In reality, four adult passengers and 200 lbs of luggage add 800+ lbs to the vehicle (every 100 lbs cuts MPG by ~1%), cruising at 75-80 mph increases fuel burn by ~20%, and under-inflated tires sap another 0.2% MPG per PSI drop. Always inflate tires to cold placard specifications and select the appropriate cruising speed tier in the calculator.

⚠️Handling Unequal Travel Legs When Friends Join Late or Depart Early

Dividing total trip fuel cost by total passenger headcount is fundamentally unfair when riders travel unequal distances (such as a passenger who rode for only 150 miles of an 800-mile journey). To resolve this friction, utilize the Multi-Leg Waypoint Segment Manager: divide the journey into distinct legs between pick-up and drop-off points, calculate fuel and tolls for each leg individually, and split each leg's specific cost only among the passengers occupying seats during that leg.

⚠️Electronic Toll Transponder Lag and Unregistered Surcharges

Toll agencies (like E-ZPass, FasTrak, SunPass, or European Vignette systems) often post electronic toll charges 2 to 4 weeks after transit, and mail-by-plate billing can charge 30% to 50% administrative surcharges over transponder rates. To avoid awkward post-trip payment requests, have the car owner check their online toll transponder portal immediately at destination arrival, or agree on a nominal $10-$20 shared toll escrow reserve collected at the start of the trip, with any unused balance refunded.

⚠️Ethanol Fuel Blends (E10 vs E15 vs E85) Distorting Fuel Economy and Range

Standard retail 87-octane gasoline in North America contains up to 10% ethanol (E10), which possesses 33% less energy density per unit volume than pure gasoline, causing a 3% to 4% reduction in fuel efficiency. Flex-fuel E85 contains up to 85% ethanol and reduces vehicle fuel economy by 25% to 30%. If filling up with E85 because the pump price appears cheaper, adjust vehicle MPG downward by 25% to determine if the cost-per-mile is truly economical.

Frequently Asked Questions

How do you calculate gas cost per person for a road trip?▼

To calculate gas cost per person for a road trip, use the formula: Per Person Cost = [(Total Miles / Vehicle MPG) * Fuel Price per Gallon + Tolls] / Number of Passengers. For example, if you drive 600 miles in an SUV that averages 25 MPG, you will consume 24 gallons of gasoline (600 / 25 = 24). At $3.50 per gallon, total gas costs $84.00 (24 * $3.50). Adding $16.00 in highway tolls brings the total communal trip cost to $100.00. Splitting this equally among 4 passengers results in exactly $25.00 per person.

Should the driver or car owner pay for gas on a road trip?▼

Standard travel etiquette and financial practice recommend that the car owner or primary driver either rides for free or receives vehicle wear compensation. The vehicle owner assumes primary vehicle depreciation, insurance liability, engine oil breakdown, and tire wear (which costs $0.18 to $0.28 per mile according to AAA). Common fair agreements include: (1) The Driver Rides Free protocol, where non-driving passengers cover 100% of fuel and tolls, or (2) All passengers (including the driver) split fuel evenly, but passengers pay the car owner a small $0.05 to $0.08 per mile wear-and-tear allowance.

How much does driving speed affect road trip gas mileage and fuel cost?▼

Driving speed dramatically influences fuel economy because aerodynamic drag increases with the square of velocity. Vehicle efficiency peaks between 45 and 55 mph. According to the U.S. Department of Energy, every 5 mph you drive over 50 mph is equivalent to paying an extra $0.25 to $0.30 per gallon for gasoline. Cruising at 75 mph burns approximately 18% to 22% more fuel than cruising at 60 mph, while driving at 80 mph burns 28% more fuel. Maintaining a steady 65 mph cruising speed on highway corridors yields optimal balance between travel time and fuel economy.

How do you split road trip gas if someone joins halfway or leaves early?▼

To split gas fairly when passengers travel unequal distances, use the segmented passenger-mile method rather than dividing the whole trip cost equally. First, divide the route into distinct legs based on where passengers board or depart. Next, calculate the fuel and toll costs for each individual leg based on that leg's distance. Finally, divide each leg's cost only among the passengers who were in the vehicle during that specific leg. This ensures that a traveler riding for only 100 miles is not unfairly forced to subsidize an 800-mile journey.

How much extra does a heavy car or roof cargo box add to road trip gas cost?▼

Every extra 100 pounds (45 kg) of passenger luggage and travel gear reduces a vehicle's fuel economy by approximately 1%. Roof racks and cargo carriers impose an even steeper aerodynamic penalty: an empty roof rack cuts highway MPG by 5% to 11%, while a fully loaded rooftop cargo box reduces highway fuel efficiency by 19% to 25% due to turbulent air resistance. On a 1,000-mile road trip, a rooftop box can add $30 to $60 in extra fuel expenses compared to packing gear inside the cabin or using a rear hitch cargo box.

Is it cheaper to drive or fly for a long-distance trip?▼

Disclaimer: This tool is provided strictly for educational and informational purposes only and does not constitute formal financial advice or a binding loan commitment. Please consult a qualified financial advisor before making decisions. Driving is almost always significantly cheaper than flying for groups of two or more travelers on trips under 500 to 600 miles. For a party of four, driving a 500-mile route costs roughly $100 to $140 in total round-trip fuel and tolls ($25 to $35 per person), whereas four round-trip domestic airline tickets typically exceed $1,000 to $1,600. Beyond 800 miles, flying becomes time- and cost-competitive once overnight hotel stops, meals on the road, and comprehensive vehicle wear (IRS benchmark $0.67/mile) are factored into the comparison.

Related Tools & Utilities

All Tools →