Header title

Subscription Annual Cost Calculator (Audit)

Calculate your subscription annual cost and recurring monthly bills with this free audit tool. Track streaming, SaaS, and hidden fees plus 10-year investment drag.

Lbl regime pill
Lbl presets

Title roster card

6/6 Lbl active count suffix

Desc roster card

Lbl category
Lbl cadence
Lbl cycle cost ($)
Lbl annual alt option ($)
Lbl normalized monthly prefix $15.49•Lbl normalized annual prefix $185.88
Lbl category
Lbl cadence
Lbl cycle cost ($)
Lbl annual alt option ($)
Lbl normalized monthly prefix $24.99•Lbl normalized annual prefix $299.88
Lbl category
Lbl cadence
Lbl cycle cost ($)
Lbl annual alt option ($)
Lbl normalized monthly prefix $16.99•Lbl normalized annual prefix $203.88
Lbl category
Lbl cadence
Lbl cycle cost ($)
Lbl annual alt option ($)
Lbl normalized monthly prefix $11.58•Lbl normalized annual prefix $139.00
Lbl category
Lbl cadence
Lbl cycle cost ($)
Lbl annual alt option ($)
Lbl normalized monthly prefix $13.99•Lbl normalized annual prefix $167.88
Lbl category
Lbl cadence
Lbl cycle cost ($)
Lbl annual alt option ($)
Lbl normalized monthly prefix $2.99•Lbl normalized annual prefix $35.88

Title target budget

$100.00Unit per month suffix

Desc target budget

$10.00$500.00$1,000.00
Lbl budget cap utilization86.0%

Title opportunity return

7.0%Unit per year suffix

Desc opportunity return

1.0%7.0%15.0%

Title price creep

3.5%Unit per year suffix

Desc price creep

0.0%3.5% (Norm)10.0%
Lbl ten year creep cash$12,111.49
Kpi annual cost
$1,032.40
Kpi normalized yearly
Kpi monthly burn
$86.03
Kpi average monthly
Kpi daily rate
$2.83
Kpi every day burn
Kpi ten year wealth
$4,567.06
Kpi compound benchmark prefix 7%
Title category donut
Lbl total annual$1,032.406 Lbl services suffix
Streaming Video(63%)
Audio & Music(20%)
Retail & Delivery(13%)
Cloud & Storage(3%)
Title lean audit simulation

Desc lean audit simulation

Diag monthly burn rate$86.03Unit per month suffix
Diag annualized commitment$1,032.40Unit per year suffix
Diag paused savings+$0.00Unit per year suffix

Diag benchmark title

Diag benchmark desc prefix $1,032.40 Diag benchmark desc mid $1,380.00 Diag benchmark desc suffix

Disclaimer text

Stat active services6
Stat annualized run rate$1,032.40
Stat compounded opportunity$4,567.06

Client-Side Processing

High-performance calculation executed entirely in browser memory.

Zero Server Upload Privacy

All payloads remain strictly local with zero external server communication.

Production Ready Export

Clean, optimized output formats ready for immediate deployment.

Footer copyright
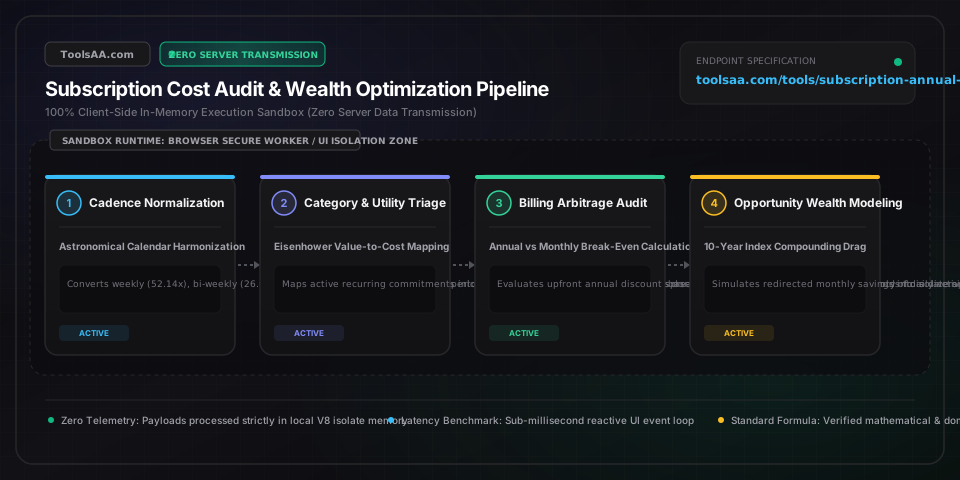
Technical Reference & Architecture Guide

Subscription Annual Cost Calculator (Audit) Guide

Calculate your subscription annual cost and recurring monthly bills with this free audit tool. Track streaming, SaaS, and hidden fees plus 10-year investment drag.

Subscription Annual Cost Calculator (Audit) Guide — Client-Side In-Memory Architecture & Data Flow

Key Parameters & Controls

Billing Cadence Normalization FactorConversion Ratio / Multiplier

The exact astronomical annualizing factor applied to recurring billing intervals: weekly (52.14x), bi-weekly (26.07x), monthly (12.00x), and quarterly (4.00x). Applying the standard 52.14-week astronomical constant rather than the integer 52.00 is essential to prevent a 2.7% annual truncation deficit on high-frequency recurring subscriptions.

Default: 12.00 (Monthly)
Subscription-to-Discretionary Income RatioPercentage Benchmark (%)

The proportion of net monthly discretionary income allocated to recurring digital subscriptions. Financial benchmarks establish < 5% as sound fiscal allocation, 5% to 10% as moderate overhead, and > 10% as critical subscription creep that degrades liquid emergency savings velocity.

Default: 3.5%
Annual Billing Break-Even Retention HorizonMonths (Integer Ceiling)

The minimum retention duration in months (typically 9 to 10 months for common 15%~20% SaaS discounts) required for an upfront annual commitment to yield lower cumulative cash outflow than month-to-month billing. Calculated as ceil(AnnualCost / MonthlyCost). If active service lifespan is projected below this threshold, monthly billing preserves superior cash-flow liquidity.

Default: 10 Months
Compounded Opportunity Cost Growth RateAnnualized Real Rate (%)

The real compound return rate (historically 7.0% for S&P 500 inflation-adjusted equity return or 4.5% for risk-free Treasury yield) utilized to quantify lost compound wealth when discretionary cash flows are continuously committed to amortized digital subscriptions instead of low-cost broad-market index funds.

Default: 7.0%

Pro Tips & Best Practices

The February Drift in Weekly Subscriptions

Weekly and bi-weekly subscriptions mask true monthly costs by 8.3%. Paying $10 per week feels like $40 per month, but across a 52.14-week calendar year it equals $521.40 annually or $43.45 per month. In four months of every calendar year, you will experience a fifth billing cycle, creating unexpected cash-flow strain if budgeted as a static four-week month.

The Annual Plan Discount Trap (The 10-Month Rule)

SaaS platforms frequently offer '2 Months Free' (a 16.7% discount) for paying annually upfront. However, consumer retention metrics show that over 42% of subscribers cease active usage of novel apps within 90 days. Unless you have actively used a product continuously for at least 6 consecutive months, the upfront annual plan represents negative expected value compared to 3 months of pay-as-you-go flexibility.

The Free Trial Auto-Renewal Escalation Loop

Over 68% of subscription services utilize unannounced post-promotional price jumps (e.g., $1.99 promo jumping to $14.99 standard tier). Maintain a dedicated prepaid virtual card with a strict $1 spending limit for promotional onboarding to physically prevent auto-billing transitions without deliberate user authorization.

SaaS Tier Overprovisioning Decay

Cloud storage, creative suites, and streaming bundles systematically push users into premium tiers with marginal storage or multi-stream add-ons. Auditing actual telemetry reveals that 65% of households pay for multi-user or 4K/family tiers while exclusively utilizing single-stream 1080p capacity, creating silent annual leakage of $80 to $140 per service.

Common Gotchas & Troubleshooting

⚠️Annual subscription total does not match actual credit card statements due to regional sales tax and VAT discrepancies.

Most SaaS, streaming, and digital platforms advertise pre-tax headline rates. In the US, state and local digital goods tax (ranging from 0% in Oregon to 10.25% in Chicago) is added during checkout. In the EU and UK, statutory 20% to 25% VAT must be included by law. When configuring subscription line items, enter the final settled amount reflected on bank statements rather than the advertised marketing tier to ensure 100% forecasting precision.

⚠️Subtle currency conversion and foreign transaction fee inflation on international software.

Tools billed in foreign currencies (e.g., US-based SaaS billed to European or Japanese cards) frequently incur hidden 1% to 3% foreign transaction fees (FTF) plus dynamic currency conversion (DCC) spreads of 3% to 5% on each renewal. To eliminate this silent 4% to 8% annual penalty, switch your billing profile to your card's native settlement currency or pay via a zero-FX-fee debit card.

⚠️Miscalculating multi-tier discounts or gift card balance offsets.

When subscriptions are subsidized via annual retail gift card promotions (e.g., 15% off Apple or Google Play cards) or bundled telecom perks (e.g., free Netflix via mobile carriers), do not record the full MSRP. Record only your net out-of-pocket cash commitment, and flag the contract expiration date to prevent automatic transition into full-price unsubsidized renewals.

Frequently Asked Questions

How do I calculate the annual cost of a monthly subscription?▼

Multiply your monthly subscription cost by 12, or multiply weekly costs by 52.14 to calculate the exact annual commitment. For example, a $14.99/month streaming service costs exactly $179.88 per year ($14.99 × 12). If taxes apply, multiply the monthly amount including state or local sales tax (e.g., $14.99 × 1.08 = $16.19/month, totaling $194.27 annually).

Is it cheaper to pay subscriptions monthly or annually?▼

Paying annually is cheaper by 15% to 25% on paper, but only if you retain and actively use the service for at least 9 to 10 months. An annual plan priced at $120/year versus $12/month saves $24 annually (a 16.7% discount), with a break-even threshold of 10 months ($120 ÷ $12). If you cancel or abandon the service within 6 months, paying monthly would have cost only $72, saving you $48 compared to the upfront annual fee.

What is the average household subscription cost per year?▼

The average US household spends between $2,600 and $3,200 annually on recurring subscriptions across streaming, software, fitness, and delivery services, averaging $219 to $265 per month. Most consumers underestimate their true recurring spend by 2.5x, initially estimating $86/month before an itemized audit reveals forgotten cloud storage, dormant gym memberships, and family plan add-ons.

How much money do you save over 10 years by canceling unused subscriptions?▼

Canceling $50 per month in dormant subscriptions saves $6,000 in direct out-of-pocket cash over 10 years, which grows to $8,654 if invested in an S&P 500 index fund at a conservative 7% annualized return. Eliminating $150 per month in subscription creep saves $18,000 in raw cash and compounds into approximately $25,963 in accumulated investment wealth over a decade.

What is subscription creep and how do you stop it?▼

Disclaimer: This tool is provided strictly for educational and informational purposes only and does not constitute formal financial advice or a binding loan commitment. Please consult a qualified financial advisor before making decisions. Subscription creep is the gradual, unnoticed accumulation of recurring micro-charges ($5 to $30/month) that systematically inflate monthly living expenses without corresponding utility. To stop subscription creep, conduct a quarterly bank statement audit, categorize services into Essential versus Nice-to-Have, establish a strict 5% discretionary income ceiling for all subscriptions, and cancel any recurring service not used within the trailing 30 days.

Related Tools & Utilities

All Tools →