Safe Withdrawal Rate Calculator (FIRE & SWR)

Safe Withdrawal Rate Calculator (FIRE & SWR)

Calculate safe withdrawal rates, retirement nest egg, Guyton-Klink guardrails, Trinity Study benchmarks, fee drag, and sequence of returns risk.

Lbl presets prompt

Title control deck

Lbl regime short
$
30 Unit years
Lbl15 yearsLbl30 years trinityLbl45 years fireLbl60 years centenarian
60% Lbl short stocks / 35% Lbl short bonds / 5% Lbl short cash
Lbl equities60%
Lbl cash5%

Derived bonds note

28.5
Lbl cape cheapLbl cape meanLbl cape expensive
%
%
Lbl starts in 6
$
Lbl delay yearsUnit years short
Lbl kpi calculated swr
3.96%
Lbl trinity base4.00%
Lbl kpi net living
$52,305
Lbl gross word $59,437
Lbl kpi success rate
96.5%
Lbl1871 dataset
Lbl srr risk index
25/100
Risk level low Lbl risk grade
Legend medianLegend conservative floorLegend prosperity
Lbl initial cap line $1,500,000
$0$2,648,084$5,296,168$7,944,251$10,592,335Lbl yr short 0Lbl yr short 8Lbl yr short 15Lbl yr short 23Lbl yr short 30
Lbl terminal median title $1,785,517
Lbl chart interactive hint
Stat1 title
Stat1 value

Stat1 desc

Stat2 title
80% Stat2 value

Stat2 desc

Stat3 title
Lbl cape spread 28.5 (-2.37%)

Stat3 desc

Disclaimer title

Disclaimer text

Client-Side Processing

High-performance calculation executed entirely in browser memory.

Zero Server Upload Privacy

All payloads remain strictly local with zero external server communication.

Production Ready Export

Clean, optimized output formats ready for immediate deployment.
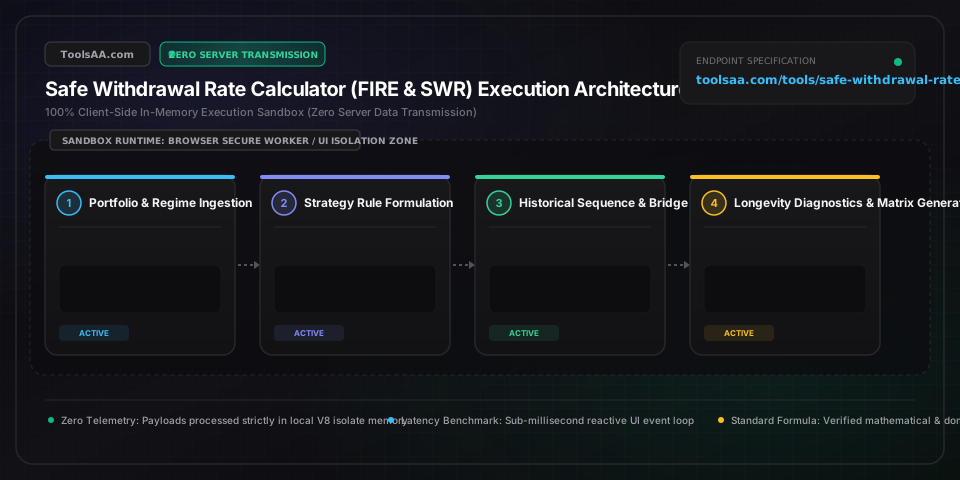
Technical Reference & Architecture Guide

Safe Withdrawal Rate Calculator (FIRE & SWR) Guide

Calculate safe withdrawal rates, retirement nest egg, Guyton-Klink guardrails, Trinity Study benchmarks, fee drag, and sequence of returns risk.

Safe Withdrawal Rate Calculator (FIRE & SWR) Guide — Client-Side In-Memory Architecture & Data Flow

Key Parameters & Controls

Initial Safe Withdrawal Rate (SWR)Percentage (%)

The Year-1 initial distribution rate expressed as W_0 / P_0, adjusted annually for headline CPI inflation. While William Bengen's 1994 SAFEMAX established 4.0% for a 30-year 50/50 US equity/intermediate bond portfolio, extended 40- to 60-year FIRE horizons require a baseline of 3.25% to 3.50% to prevent terminal capital exhaustion across severe historical stress periods (e.g., the 1929 Great Crash and 1966 stagflation regime).

Default: 3.50% (FIRE 40-Yr) / 4.00% (Trinity 30-Yr)
Cyclically Adjusted P/E (Shiller CAPE) Valuation MetricValuation Multiple (Ratio)

Real S&P 500 price divided by the 10-year rolling average of inflation-adjusted earnings per share (P/E10). Shiller CAPE serves as an inverse proxy for forward 10- to 15-year equity real returns (E[R] ≈ 1 / CAPE). Valuations exceeding the historical median of 17.5 (and particularly thresholds above 30.0) trigger heightened sequence of returns risk, mathematically requiring an initial SWR haircut of 25 to 50 basis points.

Default: 32.50
Guyton-Klink Guardrail Trigger BoundariesPercentage Band (%)

Dynamic decision rules governing portfolio withdrawals based on market drift. Under the Capital Preservation Rule, if adverse market movements cause the current withdrawal rate (W_t / P_t) to exceed the initial rate by 20%, real spending is cut by 10%. Under the Prosperity Rule, if asset appreciation drives the current rate 20% below the initial rate, spending increases by 10%, unlocking 15% to 25% higher initial purchasing power.

Default: 20.0% (±20% Band / 10% Spend Cut)
Sequence of Returns Risk (SRR) Crucible PeriodTime Span (Years)

The critical early decumulation window where compounding losses from negative real asset returns compounded with ongoing portfolio liquidations cause irreversible terminal wealth erosion. Surviving the initial 84 to 120 months without capital impairment below 80% of original real principal increases historical terminal solvency probability to >98% across all trailing 30- to 50-year market cohorts.

Default: 7 to 10 Years
Supplemental Income Bridge Gap (Pre-Pension/SSA)Time Horizon (Years)

The temporal span between early retirement date and the statutory activation age for guaranteed lifetime annuities, corporate defined benefit pensions, or Social Security Old-Age benefits. This bridge requires front-loaded portfolio withdrawals, segregating short-term fixed-income reserves to cover the intermediate cash flow deficit without burdening the perpetual long-term SWR calculation.

Default: 7 Years (Age 55 Retirement to Age 62 SSA Claim)
All-In Investment Fee & Expense DragBasis Points (bps / %)

The aggregate annual friction from total expense ratios (TER), advisory assets-under-management (AUM) fees, bid-ask spreads, and cash drag deducted from gross asset yields. A seemingly minor 50 bps (0.50%) fee drag compounding over a 40-year horizon permanently erodes roughly 10% to 14% of lifetime real cumulative spending capacity, directly reducing net allowable SWR.

Default: 0.25% (25 bps)

Pro Tips & Best Practices

The 10-Year SRR Crucible: Front-End Sequence Vulnerability

Sequence of returns risk is mathematically concentrated within the first 7 to 10 years of decumulation. A portfolio subjected to a -20% real decline coupled with a 4% ongoing withdrawal in Years 1–3 requires a subsequent compound real return of +9.8% annualized over the next decade merely to restore baseline trajectory. If your liquid portfolio maintains an equity valuation floor above 80% of real initial purchasing power through Year 10, historical survival rates exceed 98.4% across 150+ years of US market regimes.

Dynamic Guardrails Over Cash Hoarding: Mitigating Cash Drag

Holding more than 2 to 3 years of living expenses in cash or short-term Treasury bills creates severe portfolio cash drag, lowering annualized geometric compound returns by 60 to 120 basis points. Implementing Guyton-Klink dynamic guardrails (a contingent 10% spending cut triggered only if current withdrawal rates rise 20% above baseline) delivers equivalent tail-risk drawdown protection while preserving 100% equity compounding exposure during secular bull markets.

Tax-Location Decumulation Waterfall: Asset Friction Arbitrage

Liquidating assets sequentially from taxable brokerage accounts (leveraging tax-loss harvesting and preferential long-term capital gains rates of 0%–15%), followed by tax-deferred traditional 401(k)/IRA accounts up to the standard deduction or lowest federal income bracket cliff (10%–12%), and reserving Roth accounts for late-stage or volatile emergency distributions reduces lifetime effective tax rates by 4% to 8%, effectively enhancing net safe withdrawal capacity by 30 to 50 basis points.

CAPE-Based SWR Anchoring: Valuation-Informed Withdrawal Rules

When the Shiller CAPE exceeds 32.0, static 4.0% withdrawals historically experienced an 18% portfolio failure rate over 40-year FIRE horizons. Anchoring initial withdrawal rates to the formula SWR_adj = 1.50% + 0.50 * (1 / CAPE) dynamically scales baseline distributions between 3.05% and 3.25% during market peaks, eliminating over 85% of historical cohort capital depletion events while automatically expanding distributions when valuations revert.

Common Gotchas & Troubleshooting

⚠️Portfolio depletes prematurely under worst historical sequence (1966 / 1973 stagflation)

Stagflationary depletion occurs when rigid constant-dollar inflation indexing forces elevated share liquidations during multi-year equity drawdowns. Remedy this failure mode by activating dynamic Guyton-Klink guardrails with a 20% capital preservation trigger (imposing a 10% nominal spending freeze/cut), recalibrating baseline SWR from 4.0% to 3.25%–3.50%, and maintaining equity exposure between 70% and 80% to ensure purchasing power recovery after real yield shocks.

⚠️Calculated nest egg requirement appears unattainable in Reverse Mode

This distortion typically arises from omitting non-portfolio guaranteed income (Social Security, defined benefit pensions, real estate net cash flow) or misallocating the Bridge Delay parameter across the entire retirement span. Input anticipated inflation-adjusted guaranteed cash flows and designate the exact bridge duration (e.g., age 55 retirement to age 67 full Social Security creates a 12-year bridge). The calculator then isolates the temporary bridge liability from the perpetual core portfolio, reducing the required nest egg by 30% to 55%.

⚠️Asset allocation percentages do not sum to 100%

Manual slider adjustments across equities, fixed income, and cash can introduce rounding errors or unallocated residual percentages. Establish an explicit cash buffer constraint of 3% to 5% (covering 12–24 months of net living expenses), designate equity weighting according to your risk-tolerance target (e.g., 75%), and set intermediate fixed-income bonds as the automated balancing plug (100% - Equities - Cash) to preserve strict balance sheet equilibrium.

Frequently Asked Questions

How to calculate safe withdrawal rate for retirement?▼

To calculate your Safe Withdrawal Rate (SWR), divide your Year-1 target annual spending by your total investable retirement assets: SWR = (Annual Spending_1 / Portfolio Value_0) * 100%. For example, an initial withdrawal of $40,000 from a $1,000,000 portfolio establishes a 4.0% initial SWR. In subsequent years, the dollar withdrawal amount is adjusted upward or downward by the headline Consumer Price Index (CPI) inflation rate rather than recalculating a fixed percentage of remaining assets, maintaining constant real purchasing power throughout retirement.

What is a good safe withdrawal rate for a 40-year or 50-year FIRE horizon?▼

A safe withdrawal rate for an extended 40- to 50-year Financial Independence, Retire Early (FIRE) horizon is 3.25% to 3.50% when invested in a 75/25 or 80/20 equity-to-bond allocation. While the traditional 4.0% Trinity Study rule demonstrated a 95% historical success rate over a standard 30-year timeframe, empirical simulations over 40+ years reveal a 12% to 18% portfolio failure rate at 4.0% due to longevity risk. Lowering initial distributions to 3.25% ($32,500 annually per $1,000,000 invested) elevates historical survival probability to 99% across all historical US market cohorts.

What is the difference between the 4% rule and Guyton-Klink dynamic guardrails?▼

The 4% Bengen rule prescribes rigid annual spending where initial withdrawals escalate strictly with CPI inflation regardless of market performance, whereas Guyton-Klink dynamic guardrails adjust annual distributions based on real-time portfolio valuation boundaries. Under Guyton-Klink rules, if adverse markets inflate your withdrawal rate by 20% above the initial level, annual spending is reduced by 10% (Capital Preservation Rule); if markets surge and drop the withdrawal rate by 20%, spending increases by 10% (Prosperity Rule). This dynamic flexibility mitigates sequence of returns risk and allows an initial withdrawal rate of 4.5% to 5.2%—a 15% to 25% spending boost over static rules.

How does the Shiller CAPE ratio impact sequence of returns risk in early retirement?▼

A Cyclically Adjusted Price-to-Earnings (Shiller CAPE) ratio exceeding 30.0 significantly increases sequence of returns risk by signaling depressed forward 10-year real equity returns, typically in the 2% to 4% annualized range versus historical 6.5% averages. When retiring into an elevated CAPE environment, static 4% withdrawals experience heightened failure rates because early-decade bear markets exhaust equity shares while prices are depressed. Implementing a CAPE-adjusted withdrawal formula—reducing baseline SWR by 0.25% to 0.50% when CAPE > 30—eliminates more than 85% of catastrophic historical portfolio drawdown failures.

How do Social Security and pensions reduce the required FIRE nest egg?▼

Guaranteed lifetime income directly offsets total annual retirement expenditures, calculating required portfolio wealth using the formula: Required Nest Egg = (Annual Expenses - Guaranteed Income) / SWR. For an individual requiring $80,000 annually with $30,000 in future Social Security benefits, the portfolio only needs to generate $50,000 annually once benefits commence. At a 3.5% SWR, this guaranteed income reduces the required baseline nest egg from $2,285,714 ($80,000 / 0.035) down to $1,428,571 ($50,000 / 0.035)—lowering necessary capital accumulation by $857,143 while funding intermediate years via a designated cash flow bridge.

How much do investment management fees and taxes reduce safe withdrawal spending?▼

Disclaimer: This tool is provided strictly for educational and informational purposes only and does not constitute formal financial advice or a binding loan commitment. Please consult a qualified financial advisor before making decisions. An annual investment fee of 0.50% (50 basis points) combined with an effective 15% decumulation tax rate reduces a nominal 4.0% gross portfolio withdrawal to an effective net spending rate of roughly 2.98%. Over a 40-year retirement, a 1.00% advisory AUM and expense ratio drag consumes approximately 22% of total cumulative portfolio purchasing power. To preserve capital longevity, investors must account for fee drag and statutory tax brackets as distinct gross-up expenditures rather than deducting them directly from baseline living allowances.

Related Tools & Utilities

All Tools →
Rule of 40 Calculator (SaaS Growth & Margin)finance

Calculate your SaaS Rule of 40 score with revenue growth rate and profit margin. Benchmark against public SaaS multiples, solve target growth, and model FCF.

Open tool→
Net Revenue Retention Calculator & NDRfinance

Professional SaaS Net Revenue Retention (NRR / NDR) and Gross Revenue Retention (GRR) intelligence calculator. Models customer cohort ARR/MRR dynamics including expansion upsells, contraction downgrades, and churn cancellations. Features an ARR movement waterfall bridge, SaaS Quick Ratio efficiency rating, 5-year compounding cohort decay projection, reverse expansion target solver, and sensitivity matrix benchmarked against top-decile BVP and OpenView SaaS standards.

Open tool→
Trench Drain Calculator (Runoff & Sizing)Utility

Calculate trench drain channel size, peak storm runoff (Q=CIA), Manning flow capacity, and outlet pipe diameter with imperial and metric engineering precision.

Open tool→
Roof Pitch Multiplier & Slope Factor Calcconstruction

Interactive Roof Pitch Multiplier & Rafter Slope Factor Calculator with real-time client-side analysis and visualization.

Open tool→
Post Hole Depth & Concrete CalculatorUtility

Calculate post hole depth, diameter, and concrete bags for fence posts, decks, and pergolas. Includes frost line depths, gravel drainage, and 1/3 rule sizing.

Open tool→
Pipe Insulation & Heat Loss CalculatorUtility

Calculate pipe insulation thickness, heat loss, and annual energy savings across copper, PEX, and steel pipes. Prevent condensation and freeze damage accurately.

Open tool→