Short title

Cap Rate Calculator & Real Estate NOI

Institutional-grade real estate cap rate and NOI valuation calculator for commercial and residential properties. Features itemized pro-forma operating expense ledgers, reverse target acquisition solvers, mortgage debt leverage metrics (Cash-on-Cash, DSCR, break-even occupancy), dynamic 2D price-to-yield sensitivity matrices, and one-click PDF/Excel deal exports.

Lbl presets
Sec property acquisition
Step 1: Basis
Lbl purchase price$340,000
Lbl closing costs pct2.5%
Lbl initial renovation$0
Sec income
Lbl gross monthly rent$2,450
Lbl vacancy credit loss pct4%
Lbl other monthly income
$Lbl months
Sec expenses
Lbl management fee pct8%
Lbl repairs maintenance pct5%
Item total op ex
$11,044OER: 38.3%
Sec financing
Lbl down payment pct20%
Lbl interest rate pct6.875%
Lbl loan term years30 Lbl years
Lbl loan amount$272,000
Item debt service$1,787 / Lbl months
Tax Shield & Macro Risk Parameters
Marginal Tax Rate
%
Depreciation Horizon
Yrs
Building Basis %
%
Kpi cap rate
5.22%
Chart spread label: +97 Lbl bps
Kpi yield on cost
5.09%
Basis: $348,500
Kpi n o i
$17,756
$1,480 / Lbl months
Kpi cash on cash
-4.82%
Kpi net cash flow: -$3,686
Kpi d s c r
0.83x
Lbl coverage deficit
Kpi break even occupancy
108.3%
Kpi debt yield: 6.5%
Chart title
Item g s i$30,000
Cash Flow: -$3,686Debt: $21,442OpEx: $11,044Vac: $1,200
Chart spread

Institutional risk premium over the sovereign risk-free rate. High spreads reward operational risk; compressed spreads suggest elevated asset pricing.

Chart benchmark label:%
Chart spread label
+97Lbl bps
Cap (5.22%) - 10Y (4.25%)

Solver title

Solver desc

Lbl target cap rate7.50%
4.0% (Core Trophy)6.5% (Class B)8.5% (Value Add)12.0% (Opportunistic)
Lbl max offer price$236,747
Lbl price difference:-$103,253
Lbl required n o i$25,500
Lbl required monthly rent:$3,223 / Lbl months
Lbl disclaimer

Disclaimer text

Sovereign Yield Spread+97 bpsChart benchmark label: 4.25%
Free Cash Flow & Levered Yield-4.82%Pre-Tax: -$3,686
Lender Coverage Margin0.83xKpi debt yield: 6.5%
Technical Reference & Architecture Guide

Cap Rate Calculator & Real Estate NOI Guide

Institutional-grade real estate cap rate and NOI valuation calculator for commercial and residential properties. Features itemized pro-forma operating expense ledgers, reverse target acquisition solvers, mortgage debt leverage metrics (Cash-on-Cash, DSCR, break-even occupancy), dynamic 2D price-to-yield sensitivity matrices, and one-click PDF/Excel deal exports.

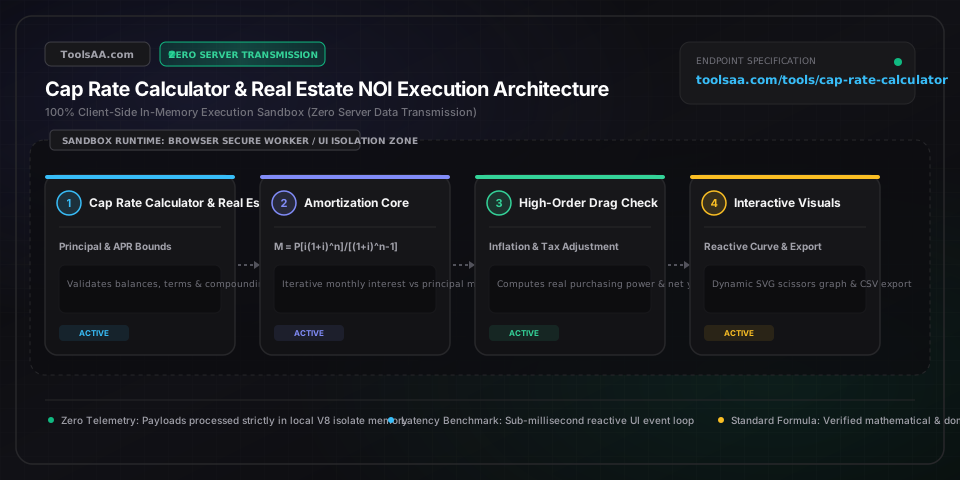
Cap Rate Calculator & Real Estate NOI Guide — Client-Side In-Memory Architecture & Data Flow

Key Parameters & Controls

Gross Scheduled Rent (GSR) / Potential Gross Income (PGI)Currency (USD / Annualized)

The theoretical maximum gross contractual rent roll assuming 100% physical occupancy at in-place lease or market rates prior to concessions. Institutional underwriting audits GSR against trailing-12 (T12) collections, stripping out tenant utility reimbursements and volatile non-guaranteed ancillary income. Pro-forma forward forecasting mandates annual inflation escalations between 2.00% and 3.50%, strictly bounded by municipal rent stabilization ordinances and local CPI-U indices.

Default: $180,000
Economic Vacancy & Credit Loss AllowancePercentage (0.00% - 100.00%)

The blended operational deduction reflecting physical tenant turnover, frictional vacancy, bad debt write-offs, and rent concessions. Agency underwriting standards (Fannie Mae DUS, Freddie Mac Multi-Family, and HUD/FHA) establish a non-negotiable underwriting floor of 5.00% to 7.00% even for properties demonstrating 100% physical occupancy. For workforce housing, tertiary markets, or single-tenant commercial assets, stress testing mandates an 8.00% to 12.50% economic vacancy buffer.

Default: 5.00%
Pro-Forma Operating Expenses (OpEx Ledger)Currency (USD / Annualized)

Total recurring disbursements essential to maintain ongoing property operations: ad valorem real estate taxes, property/casualty/flood insurance, professional third-party management (standardized at 4.00% to 8.00% of Effective Gross Income), routine repairs, contract landscaping, and common area utilities. Operating Expense Ratios (OER) benchmark between 35.00% and 45.00% for commercial triple-net assets and 45.00% to 55.00% for residential multifamily, strictly excluding debt service and discretionary capital expenditures.

Default: $68,000
Capital Replacement Reserves (Above-the-Line CapEx)Currency (USD / Unit / Year)

Mandatory annualized capital reserve escrows dedicated to recurring structural replacements (roof membranes, commercial HVAC chillers, asphalt paving, elevators) governed by ASHRAE lifecycle tables. Institutional asset managers require $250 to $450 per residential unit annually and $0.15 to $0.35 per commercial square foot. Deducting reserves above the line generates institutional Net Operating Income (NOI), eliminating the artificial yield inflation common in retail broker memorandums.

Default: $4,000
Total Acquisition Basis (Gross Capital Outlay)Currency (USD)

The comprehensive capitalization basis comprising negotiated contract price plus uncapitalized transaction frictions: title and escrow fees, transfer stamps, legal retainers, Phase I environmental site assessments (ESA), Property Condition Assessments (PCA), and lender origination fees. Underwriting cap rate solely against contract price without transaction costs artificially inflates true unleveraged economic yield by 25 to 75 basis points.

Default: $1,450,000
Target Exit Hurdle Rate / Market Cap RatePercentage (Yield Spread)

The minimum unleveraged yield demanded by fund investment committees to justify illiquidity risk over the risk-free benchmark (10-Year US Treasury yield). Institutional Class A core multifamily trades at compressed yields of 4.25% to 5.25%, Class B suburban assets target 5.50% to 6.75%, while Class C workforce housing and secondary commercial office space mandate risk premiums between 7.50% and 10.50%+.

Default: 6.75%

Pro Tips & Best Practices

The Post-Acquisition Ad Valorem Property Tax Cliff

Never underwrite pro-forma Net Operating Income using the seller's trailing-12 (T12) historical property tax expense. In jurisdictions without statutory acquisition caps, the county tax assessor automatically resets the assessed value to your contracted purchase price post-closing. If an asset held for twenty years is purchased for $2,500,000 against a historical assessed value of $1,100,000, your annual property tax expense can double in Year 1. This creates an unmodeled $15,000 to $30,000 operational leakage, immediately compressing an apparent 6.50% acquisition cap rate down to an underwater 5.30%. Always compute pro-forma taxes using: (Negotiated Purchase Price * Local Millage Rate * Equalization Ratio).

Above-the-Line vs. Below-the-Line CapEx Reserve Distortion

Broker Offering Memorandums (OMs) consistently shift recurring capital replacement reserves (water heaters, carpet turns, HVAC compressor replacements) 'below the line' into discretionary capital improvements to artificially inflate reported NOI and present an aggressive cap rate. Institutional CFA standards require deducting recurring capital reserves ($300 to $500 per unit annually) 'above the line' before computing NOI. Overlooking a $25,000 recurring reserve allowance on a commercial asset capitalized at a 5.00% cap rate results in an immediate $500,000 overvaluation of the property basis ($25,000 / 0.05).

Negative Financial Leverage and the DSCR Insolvency Spiral

When a property's unleveraged cap rate is lower than the mortgage loan debt constant (annual mortgage principal and interest divided by total loan balance, determined by loan APR and amortization schedule), the investment enters Negative Financial Leverage. For example, financing an asset acquired at a 5.75% cap rate with commercial bank debt carrying an annual debt constant of 7.10% means every dollar borrowed dilutes equity returns, driving Cash-on-Cash yield below 4.00% and compressing the Debt Service Coverage Ratio (DSCR) below the institutional 1.20x safety covenant.

Marginal Tax Bracket Shielding vs. Section 1250 Recapture Frictions

Unleveraged cap rate evaluates operational pre-tax productivity, completely ignoring marginal income tax brackets and tax shelter mechanics. High-net-worth investors in the 37.0% federal tax bracket (+ 3.8% Net Investment Income Tax) often deploy cost segregation to accelerate bonus depreciation under IRC Section 168(k) against active income (via Section 469(c)(7) Real Estate Professional Status). However, aggressive depreciation deductions trigger IRC Section 1250 depreciation recapture taxed at an unyielding 25.0% federal rate upon disposition unless rolled over through a strict 180-day Section 1031 like-kind exchange structure.

Common Gotchas & Troubleshooting

⚠️Calculated Cap Rate is abnormally high (>11.0%), but Cash-on-Cash return is negative or negligible.

An ultra-high headline cap rate paired with poor equity distributions signals one of two structural defects: (1) Severe negative debt leverage, where the lender's loan APR and amortization constant exceed the asset's cap rate, or (2) Phantom NOI resulting from gross rent rolls that include delinquent or non-paying tenants. To resolve this, audit bank deposit slips (not accounting accrual ledgers) for the preceding 12 months, deduct an expanded economic vacancy buffer (minimum 10.0% to 15.0%), and verify that annual debt service is subtracted before measuring investor cash distributions.

⚠️Broker pro-forma NOI is 15% to 25% higher than trailing-12 (T12) audited tax return operating figures.

Commercial brokers routinely strip out real operating expenses under the pretense of 'one-time owner expenses'—frequently eliminating property management fees (assuming self-management), cutting repairs to zero, or omitting municipal utility escalations. Reconcile the pro-forma against IRS Form 8825 or Schedule E federal filings. Reinstate a mandatory 5.0% third-party management fee, insert standard replacement reserves, and recalculate the maximum purchase price using audited T12 NOI to prevent an unrecoverable multi-hundred-thousand-dollar acquisition overpayment.

⚠️Commercial bank appraisal comes in below contract price despite matching market cap rate benchmarks.

Appraisers derive capitalization rates from verified closed comparable sales ('comps') and apply a terminal cap rate expansion buffer of 25 to 50 basis points over prevailing in-place rates to reflect exit liquidity risk. Furthermore, institutional appraisers haircut forward pro-forma rent increases that lack executed leases. Resolve an appraisal shortfall by negotiating an earn-out escrow with the seller (releasing funds only once target rent rolls are sustained for 90 consecutive days) or restructuring the purchase contract price to match the appraiser's stabilized in-place NOI.

Frequently Asked Questions

How do you calculate real estate cap rate and NOI from a property rent roll?▼

Capitalization Rate is calculated using the formula: Cap Rate (%) = (Net Operating Income / Property Purchase Price) * 100, where Net Operating Income (NOI) equals Effective Gross Income (Gross Scheduled Rent minus Economic Vacancy and Credit Loss) minus all operating expenses. For example, a 10-unit multifamily building generating $180,000 in Gross Scheduled Rent with a 5.0% vacancy deduction ($9,000) produces an Effective Gross Income of $171,000; subtracting $65,000 in verified operating expenses (property taxes, insurance, management, maintenance, and replacement reserves) leaves an annual NOI of $106,000. If the purchase basis is $1,500,000, the unleveraged Cap Rate is ($106,000 / $1,500,000) * 100 = 7.07%.

What is a good capitalization rate for commercial and residential rental property?▼

A good capitalization rate typically ranges between 5.50% and 7.50% for stabilized suburban real estate, but acceptable hurdle rates vary according to asset classification, market tier, and prevailing 10-Year Treasury yields. Institutional Class A core assets in primary gateway markets (New York, San Francisco, London) trade at compressed cap rates between 3.80% and 5.00% due to superior liquidity and inflation-hedging capital appreciation. In secondary and tertiary markets, Class B assets trade between 5.75% and 7.00%, while higher-turnover Class C workforce housing and secondary commercial office spaces require cap rates between 7.50% and 10.50%+ to compensate for tenant default risk and elevated capital maintenance.

What is the difference between Cap Rate, Cash-on-Cash Return, and IRR?▼

The defining differences are debt leverage and investment duration: Cap Rate measures unleveraged property operating yield against total valuation, Cash-on-Cash (CoC) measures leveraged cash dividend return on out-of-pocket equity, and Internal Rate of Return (IRR) evaluates annualized total performance across the multi-year investment lifecycle. For example, acquiring a $1,000,000 property generating $70,000 NOI yields a 7.00% Cap Rate. If financed with $250,000 cash down and a $750,000 mortgage requiring $48,000 annual debt service, pre-tax cash flow is $22,000, resulting in an 8.80% Cash-on-Cash return ($22,000 / $250,000). A 5-year IRR model combines these cash yields with loan principal amortization and net exit sales proceeds to reflect total compounded returns, typically targeting 12.00% to 16.00%.

Why is mortgage debt service excluded from Cap Rate but included in DSCR?▼

Mortgage debt service is excluded from Cap Rate because capitalization rate isolates the intrinsic operational efficiency of real estate independent of an investor's financing structure, whereas the Debt Service Coverage Ratio (DSCR = NOI / Annual Debt Service) measures debt default risk for mortgage lenders. Twin properties producing identical $120,000 NOIs maintain the exact same 6.00% cap rate at a $2,000,000 valuation regardless of whether one buyer pays 100% all-cash and another secures an 80% LTV commercial loan. In contrast, commercial lenders require a minimum DSCR of 1.20x to 1.35x to ensure property cash flow covers annual principal and interest with a 20% to 35% safety margin against tenant vacancies.

How do you calculate maximum offer price using a target acquisition cap rate?▼

Calculate Maximum Allowable Offer (MAO) by inverting the capitalization rate formula: Maximum Purchase Price = Property NOI / Target Cap Rate. If audited trailing-12 financial records establish a stable unleveraged NOI of $95,000 and your investment hurdle mandates a minimum 6.75% capitalization rate (0.0675), your maximum offer price is $95,000 / 0.0675 = $1,407,407. If the property is listed for $1,600,000, the entry cap rate compresses to 5.94%, meaning you must negotiate a discount of $192,593 or identify concrete operational efficiencies (e.g., utility submetering, loss-to-lease burnoff) to achieve your target yield.

How does the 50% rule compare to an itemized pro-forma NOI calculation?▼

Disclaimer: This tool is provided strictly for educational and informational purposes only and does not constitute formal financial advice or a binding loan commitment. Please consult a qualified financial advisor before making decisions. The 50% rule is an informal deal-screening heuristic assuming that operating expenses (excluding mortgage debt) will consume exactly 50% of Effective Gross Income, whereas an itemized pro-forma models specific line-item historical disbursements for property taxes, insurance, management, maintenance, utilities, and capital reserves. On a property generating $150,000 in gross annual rent, the 50% rule estimates $75,000 in expenses and $75,000 in NOI. However, using this rule for contract underwriting introduces severe errors in commercial triple-net (NNN) leases (where tenants cover all OpEx and expense ratios drop below 15%) or in high-tax jurisdictions and aging Class C assets where operating expense ratios regularly exceed 58% to 65%.
Related Tools & Utilities

All Tools →