DIO Calculator (Days Inventory Outstanding)

DIO Calculator (Days Inventory Outstanding)

Calculate Days Inventory Outstanding (DIO) and DSI turnover from COGS and inventory. Model working capital cash release and benchmark industry inventory days.

Lbl quick presets

Title control deck

US GAAP (ASC 330)

US GAAP allows FIFO, LIFO (subject to IRC §472 Conformity Requirement), and Weighted Average. Lower of Cost or Net Realizable Value applies.

$
$
$
365Unit days
35 Unit days
5 Unit days (Lean JIT)45 Unit days (DTC Normal)90 Unit days (Mfr.)180 Unit days (Pharma)
Lbl current vs target50.0d → 35d (-15.0d)
Lbl cash unlock live$150,000
22%

Hint carrying breakdown

Lbl dio metric
50.0
Unit days (DSI)
Lbl itr metric
7.30
Unit turns per year
Lbl daily cogs metric
$10,000
Lbl per day
Lbl avg stock metric
$500,000
Lbl calculated mean
Title velocity gauge
Lbl sector standing prefix C
0d45d90d135d180d
50.0 Unit days
Lbl current dioLbl target goal: 35d
< 35 Unit daysLbl tier lean
35 - 75 Unit daysLbl tier normal
> 75 Unit daysLbl tier high
Title cfa insights

Title compounding

Desc compounding

Formula holding
Title tax mechanics

Desc tax mechanics

Formula lifo reserve
Title stockout risk

Desc stockout risk

Formula safety stock
Primary Metric50.0 Unit days
Efficiency / Capacity7.30x
Net Output$150,000
Stats card4$33,000
Stats card5$10,000
Stats card6C
Technical Reference & Architecture Guide

DIO Calculator (Days Inventory Outstanding) Guide

Calculate Days Inventory Outstanding (DIO) and DSI turnover from COGS and inventory. Model working capital cash release and benchmark industry inventory days.

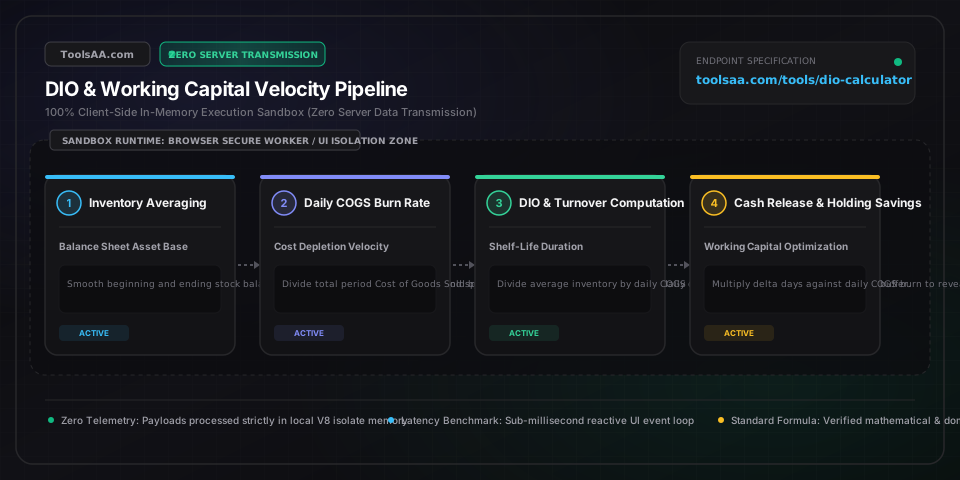
DIO Calculator (Days Inventory Outstanding) Guide — Client-Side In-Memory Architecture & Data Flow

Key Parameters & Controls

Beginning Inventory BalanceBalance sheet asset carrying value

Total book value of raw materials, work-in-progress (WIP), and finished goods at the start of the fiscal period under GAAP/IFRS valuation standards.

Default: $450,000
Ending Inventory BalanceBalance sheet asset carrying value

Total book value of inventory at the close of the period, net of inventory reserves and obsolescence allowances. Averaged with beginning inventory to neutralize seasonal spikes.

Default: $550,000
Cost of Goods Sold (COGS)Income statement operating cost

Direct material, direct labor, and allocated manufacturing overhead absorbed during the period. Must strictly exclude selling, general, and administrative (SG&A) expenses.

Default: $3,650,000
Accounting Period DaysStatutory calendar convention

Standard duration divisor: 365 days for calendar annual reporting, 360 days for commercial banking conventions, or 90 to 91.25 days for quarterly financial filings.

Default: 365 Days
Annual Carrying Cost RateHurdle rate / overhead percentage

Weighted annual holding drag (typically 18% to 30%), including cost of capital (WACC), warehouse leasing, handling, logistics, shrinkage, insurance, and obsolescence write-downs.

Default: 22.0%
Target Days Inventory OutstandingWorking capital benchmark milestone

Strategic corporate objective for inventory velocity. Reductions directly liberate liquid operating cash and reduce financing overhead.

Default: 35 Days

Pro Tips & Best Practices

Never Substitute Sales Revenue for COGS in the Denominator

Dividing Average Inventory by Net Sales Revenue instead of Cost of Goods Sold is the single most common error in working capital analysis. Because Sales Revenue includes gross profit margin, using revenue artificially deflates DIO by 25% to 55%, producing an illusion of hyper-lean velocity while masking severe cash trapped in warehouses.

Neutralize Seasonal Quarter-End Inventory Window Dressing

A simple two-point average ((Beginning + Ending) / 2) can be severely distorted by fiscal year-end tax avoidance inventory sell-offs or pre-holiday stockpiling. For cyclical retailers and seasonal producers, calculate average inventory using a 12-month rolling average (sum of 12 month-end balances divided by 12) for true operational DIO.

Account for LIFO vs FIFO Balance Sheet Distortions Under US GAAP

Companies utilizing LIFO (Last-In, First-Out) under US GAAP report older, deflated historical inventory values on the balance sheet during inflationary periods while expensing modern high costs in COGS. This produces an artificially lower DIO compared to IFRS competitors reporting under FIFO or Weighted Average Cost. Always add the LIFO Reserve back to inventory for apples-to-apples peer benchmarking.

Respect the Safety Stock Threshold Before Chasing Zero DIO

Driving DIO below the supplier delivery lead time plus safety stock cushion triggers stockouts, line shutdowns, and expedited air-freight penalties. In most industrial supply chains, a 1% stockout rate causes gross revenue losses that dwarf the 20% annual carrying cost savings of trimming 3 additional inventory days.

Common Gotchas & Troubleshooting

⚠️Calculated DIO appears abnormally low (under 15 days) despite warehouse capacity reaching 95%

Verify that Cost of Goods Sold (COGS) is used rather than Net Revenue. Furthermore, check whether severe inventory impairment write-downs or LIFO reserve deductions were taken against ending inventory, which artificially shrinks balance sheet asset value without moving physical cartons.

⚠️Quarterly DIO calculation produces results 4x higher than expected peer benchmarks

Ensure the period days parameter is set to 90 (or 91.25) days rather than 365 days. If using 365 days, quarterly COGS must first be annualized (multiplied by 4) before dividing into average quarterly inventory.

⚠️Working Capital Cash Unlock displays a negative number when entering target DIO

A negative cash unlock indicates your Target DIO is higher than your Current DIO. This represents an intentional inventory buildup (e.g. buffering for tariff increases or seasonal ramp-up), which consumes and absorbs liquid cash rather than liberating it.

⚠️Average inventory is distorted by recent mergers or subsidiary acquisitions during the fiscal year

Switch from 'Beginning & Ending Inventory' mode to 'Direct Average Inventory' mode. Compute a weighted-average inventory balance weighted by post-acquisition operating days to prevent unearned capital distortion.

Frequently Asked Questions

How do you calculate Days Inventory Outstanding with formula?▼

Days Inventory Outstanding (DIO) is calculated with the formula: DIO = (Average Inventory / Cost of Goods Sold) * 365 days, where Average Inventory = (Beginning Inventory + Ending Inventory) / 2. For example, if a business holds $500,000 in average inventory and incurs $3,650,000 in annual COGS, its Daily COGS is $10,000 ($3,650,000 / 365). Dividing $500,000 by $10,000 yields a DIO of exactly 50.0 days.

What is a good Days Inventory Outstanding benchmark by industry?▼

A 'good' DIO depends strictly on industry asset turnover norms: Grocery and perishable food retail benchmarks at 15 to 30 days; Consumer Electronics averages 30 to 50 days; Fast-Fashion Apparel benchmarks at 60 to 90 days; Industrial Machinery and OEM manufacturing operates at 65 to 90 days; and Pharmaceuticals or Aerospace can comfortably exceed 100 to 180 days due to stringent regulatory stability testing, safety batch holds, and long production lead times.

What is the difference between DIO and Inventory Turnover Ratio?▼

DIO and Inventory Turnover Ratio (ITR) are mathematical inverses representing the same velocity from two perspectives. Inventory Turnover measures how many complete cycles an enterprise sells and replaces its stock per fiscal year (COGS / Average Inventory). DIO converts that turnover frequency into calendar duration (365 / Inventory Turnover), indicating the exact number of days buffer stock remains on the shelf before turning into delivered revenue.

How does reducing DIO free up operating cash flow?▼

Every single day shaved off DIO permanently liberates exactly one day of Cost of Goods Sold into liquid operating cash: Cash Freed = (Current DIO - Target DIO) * (Annual COGS / 365). For a company with $36.5 million in annual COGS, reducing DIO by just 10 days instantly releases $1,000,000 in trapped working capital, while eliminating approximately $220,000 in recurring annual warehouse carrying and financing costs at a 22% holding rate.

Can Days Inventory Outstanding ever be negative?▼

Disclaimer: This tool is provided strictly for educational and informational purposes only and does not constitute formal financial advice or a binding loan commitment. Please consult a qualified financial advisor before making decisions. No, standard DIO cannot mathematically be negative because physical inventory balances and Cost of Goods Sold are positive values. However, in dropshipping models or digital software distribution where physical inventory is zero, DIO is 0. If negative values appear in custom software, it stems from negative inventory ledger errors caused by asynchronous billing before receiving receipts.

Related Tools & Utilities

All Tools →