Nav back to hub
Short title

OEE Calculator & Equipment Efficiency

Calculate OEE (Overall Equipment Effectiveness) instantly. Track Availability, Performance, and Quality, analyze Six Big Losses, and simulate throughput gains.

Lbl presets bar
Speed standard
Lbl operating timeLbl net: 450 Lbl minutes
8.0 Lbl hours
Lbl minutes
Lbl exclusions
Lbl minutes
Loss1 category
Lbl minutes
Lbl minutes
Loss3 category
1 BPM
Lbl seconds
Lbl parts
Loss5 category
Lbl parts
Lbl parts
Currency mode
$/Lbl hours
$/Lbl each
Lbl o e eStatus typical
72.5%Lbl target: 85%
Lbl gap to world class:-12.5%
Lbl availabilityLbl goal prefix: 90%
82.2%
Lbl operating time text:370 Lbl minutes
Lbl planned stoppage:80 Lbl minutes
Lbl performanceLbl goal prefix: 95%
90.8%
Lbl ideal net time:336.0 Lbl minutes
Lbl speed loss text:34.0 Lbl minutes
Lbl qualityLbl goal prefix: 99.9%
97.1%
Lbl good units text:466
Lbl scrap rejects text:14
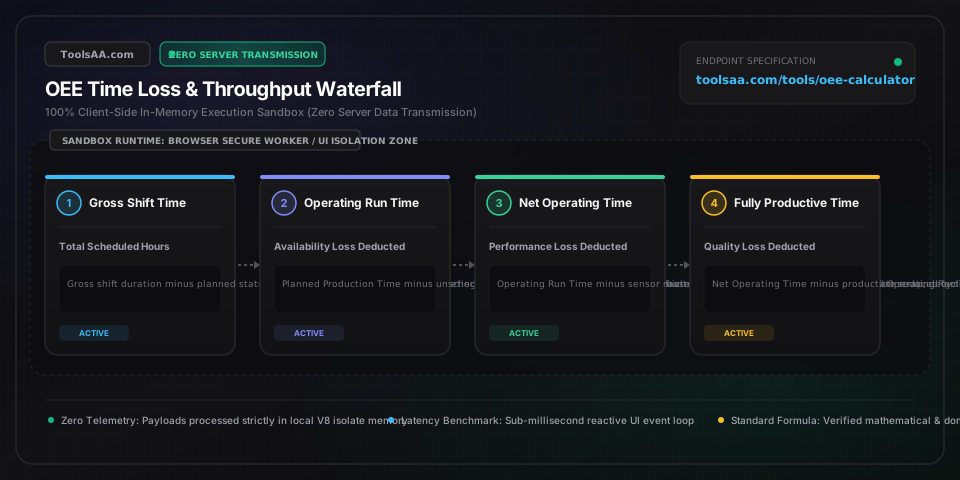
Lbl time waterfallSvg fully productive: 326.2 / 480 Lbl minutes
Svg gross shift: 480 Lbl minutes (100%)Svg planned prod: 450 Lbl minutesSvg operating time: 370 Lbl minutesSvg fully productive: 326.2 Lbl minutes (Lbl o e e: 72.5%)
Legend planned breaks
Legend downtime setup
Legend operating net
Legend fully productive
Lbl t e e p22.7%

Hint asset utilization

Lbl good units466

Lbl yield: 97.1%

Lbl defect rate4.58%

14 Lbl scrap short + 8 Lbl rework short

Lbl financial loss total$1,096

Hint per shift burn
Lbl overall o e e72.5%
Lbl availability82.2%
Lbl performance90.8%
Lbl quality97.1%
Lbl t e e p22.7%
Lbl opportunity loss stat$1,096
Disclaimer titleDisclaimer note
Technical Reference & Architecture Guide

OEE Calculator & Equipment Efficiency Guide

Calculate OEE (Overall Equipment Effectiveness) instantly. Track Availability, Performance, and Quality, analyze Six Big Losses, and simulate throughput gains.

OEE Calculator & Equipment Efficiency Guide — Client-Side In-Memory Architecture & Data Flow

Key Parameters & Controls

Planned Production Time (PPT)Duration in Minutes

Scheduled shift duration minus statutory planned stoppages such as designated meal breaks, legal rest periods, and scheduled preventive maintenance shutdowns.

Default: 450 mins (8 hr shift minus 30 min meal break)
Operating Time (Run Time)Duration in Minutes

The exact duration the production asset was energized and actively attempting to cycle, computed as Planned Production Time minus unplanned equipment breakdowns and setup adjustments.

Default: 370 mins
Ideal Cycle Time (Nameplate Standard)Seconds per Unit or Units per Minute

The theoretical minimum process time engineered by the machine manufacturer under zero-friction conditions. Must represent pure design capacity rather than budgeted or degraded operational speeds.

Default: 42.0 seconds/unit
Availability Rate (A)Percentage Ratio

The proportion of scheduled production time that the machine is actively operational. Gold world-class manufacturing benchmark established by TPM standards is 90.0% or higher.

Default: >= 90.0%
Performance Efficiency (P)Percentage Ratio

The operating speed ratio comparing actual output to theoretical design speed during operating time, capturing micro-stops under 5 minutes and chronic equipment idling. Gold benchmark is 95.0% or higher.

Default: >= 95.0%
Quality Rate (Q)Percentage Ratio

The ratio of first-pass good units to total units entered into the process, excluding defect parts, startup scrap, and unverified rework. Six Sigma world-class benchmark is 99.9% or higher.

Default: >= 99.9%
Overall Equipment Effectiveness (OEE)Composite Percentage Index

The unified metric multiplying Availability by Performance by Quality. Measures truly productive manufacturing capability. World-class benchmark established by TPM guidelines is 85.0% or higher.

Default: >= 85.0%
Total Effective Equipment Performance (TEEP)Asset Utilization Percentage

Macro asset utilization index measuring productive output against total calendar time (24 hours per day, 365 days per year, 168 hours per week), revealing dormant capacity without capital expenditure.

Default: 50.0% to 75.0%

Pro Tips & Best Practices

The Micro-Stop 'Hidden Factory' Blindspot

Stoppages under 3 to 5 minutes (such as bin misfeeds, photo-eye blinding, or brief package jams) are almost never logged by manual paper shift sheets. Operators tend to record these as continuous running, which artificially inflates calculated Availability while severely suppressing Performance percentage. If your Performance is chronically below 85% while Availability appears above 95%, micro-stops are your primary hidden bottleneck.

The Nameplate Speed Standard Pitfall

Never calibrate Ideal Cycle Time using historical averages, budgeted standards, or operator-adjusted comfortable run rates. Doing so institutionalizes chronic line speed degradation and can generate mathematically impossible Performance figures over 100%. Always input the original equipment manufacturer (OEM) design nameplate speed as the true theoretical ceiling.

Setup & Changeover Allocation Boundary

Product and tooling changeovers represent Availability Loss, not planned exclusions from Planned Production Time. Excluding changeover duration from your baseline denominator flatters the reported OEE score while disguising high-return Lean SMED (Single-Minute Exchange of Die) quick-changeover opportunities.

Reworked Parts Accounting Violation

Never record reworked parts as 'Good' in your primary Quality ratio. Rework consumes extra machine cycle time, operator labor, and tool life. The Quality pillar in OEE strictly measures First-Pass Yield (FPY); any part requiring secondary corrective intervention must be registered as a Quality defect.

Common Gotchas & Troubleshooting

⚠️Performance calculation outputs an impossible value exceeding 100%.

Verify the Ideal Cycle Time setting and cavitation count. An OEE Performance rate over 100% occurs when the configured Ideal Cycle Time is slower than the machine's true mechanical capability, or when multi-cavity tooling outputs multiple parts per stroke while the cycle timer is calibrated for single-part production.

⚠️OEE score appears respectable (above 80%) but customer ship dates and plant quotas are consistently missed.

Examine Planned Production Time exclusions. If scheduled maintenance, shift changeovers, cleaning, and sanitization total 3+ hours per shift and are excluded from PPT, OEE measures only an artificially narrow production window. Switch to the TEEP metric to assess total calendar asset utilization across 168 weekly hours.

⚠️Availability drops precipitously when operators log tooling adjustments as breakdowns.

Establish a strict demarcation between catastrophic equipment failure (unplanned breakdown) and planned operational adjustments (setup/changeover). Track both within the Six Big Losses waterfall to prioritize preventive maintenance versus standardized work procedures.

Frequently Asked Questions

What is the exact formula to calculate OEE?▼

OEE is calculated by multiplying Availability, Performance, and Quality: OEE = Availability × Performance × Quality. Specifically, Availability equals Operating Time divided by Planned Production Time; Performance equals (Total Units Produced × Ideal Cycle Time) divided by Operating Time; and Quality equals Good Units divided by Total Units Produced. Simplified algebraically, OEE equals (Good Units × Ideal Cycle Time) divided by Planned Production Time.

What is considered a good or world-class OEE score in manufacturing?▼

A world-class OEE score is widely recognized as 85.0% or higher, a standard originated by Seiichi Nakajima for Total Productive Maintenance (TPM). This benchmark consists of 90.0% Availability, 95.0% Performance, and 99.9% Quality. In practice, most typical industrial manufacturing operations run between 55.0% and 65.0% OEE, meaning an 85% score represents top-decile operational efficiency.

What is the difference between OEE and TEEP?▼

The fundamental difference lies in the baseline denominator: OEE divides productive output by Planned Production Time (excluding planned plant shutdowns, weekends, holidays, and unstaffed shifts), whereas TEEP (Total Effective Equipment Performance) evaluates output against all 24/7 calendar time (168 hours per week). TEEP measures true macroeconomic capital utilization and reveals whether output can be increased without purchasing new machinery simply by adding operational shifts.

What are the Six Big Losses in OEE and how do they map to Availability, Performance, and Quality?▼

The Six Big Losses categorize equipment waste into three distinct operational pairs: Availability Losses encompass (1) Unplanned Equipment Breakdowns and (2) Setup and Changeover Adjustments; Performance Losses encompass (3) Small Micro-Stops/Idling (under 5 minutes) and (4) Reduced Operating Speed; Quality Losses encompass (5) Startup and Warmup Rejects and (6) In-line Production Scrap. Addressing each specific loss directly recovers percentage points in its corresponding OEE pillar.

How do I calculate OEE when running multiple products with different cycle times on the same shift?▼

When producing multiple SKUs with varying cycle times during one shift, calculate Net Operating Time by summing the product of each SKU's total unit count and its unique Ideal Cycle Time: Net Operating Time = Σ(SKU_Count_i × Ideal_Cycle_Time_i). Then divide this aggregate Net Operating Time by the actual total Operating Run Time to obtain an accurate, unskewed composite Performance percentage.

Related Tools & Utilities

All Tools →
Crawl Space Vapor Barrier & Liner CalculatorUtility

Calculate crawl space vapor barrier square footage, rolls, seam tape, foundation butyl, and pier wrap. Includes IRC R408.3 code checks, roll optimizer, and costs.

Open tool→
Hydraulic Cylinder Force & Sizing Calculatorengineering

Calculate hydraulic cylinder push and pull force, annular piston area, stroke velocity, cycle time, pump motor HP, and Euler rod buckling limits in real time.

Open tool→
SaaS Magic Number & CAC Payback Calculatorfinance

Enterprise-grade SaaS Magic Number, CAC Payback, and Sales Efficiency calculator. Features gross margin adjustment, lagged S&M modeling, reverse target goal solving, and dynamic sensitivity matrix analysis based on Scale Venture Partners and Bessemer benchmarks.

Open tool→
V-Belt Length & Center Distance Calculatorengineering

Calculate exact V-belt pitch, inside, and outside lengths, center distance, sheave wrap angles, and snap to nearest standard RMA or ISO catalog sizes.

Open tool→
Wire Rope Tension & Rigging CalculatorUtility

Professional engineering calculator for wire rope tension, crane multi-part reeving efficiency, bridle sling vector forces, winch snatch blocks, and catenary guy wire sag-tension. Complies with ASME B30.5, ASME B30.9, OSHA 1926.1414, and EN 12385 standards with dynamic D/d bending derates and reverse safety factor sizing.

Open tool→
Soffit Vent Calculator & Attic Intake (NFA)Utility

Professional IRC-compliant attic ventilation calculator that sizes required soffit vents, continuous strip lengths, Net Free Area (NFA), and uniform on-center eave spacing under IRC R806.1 (1/150) and R806.2 (1/300) codes. Features real-time airflow pressure balance meters, rafter bay collision detection, reverse attic capacity solving, and client-side contractor cut sheets.

Open tool→