DPO Calculator & Days Payable Outstanding
Badge finance•Badge client privacy

DPO Calculator & Days Payable Outstanding

Interactive DPO Calculator (Days Payable Outstanding & AP Turnover) with real-time client-side analysis and visualization.

Lbl scenario presets
Tab standard dpoUSD_365
$182,500,000
$

Hint cogs

$36,500,000
$

Hint ending ap

365 Unit days
Title advanced cfa
Kpi primary dpo
73.0Unit days
Kpi primary dpo desc
Kpi ap turnover
5.00Unit times
Kpi ap turnover desc
Kpi daily burn
$500,000
Kpi daily burn desc
Kpi ccc
-22.5Unit days
Lbl customer funded float
Tag extended leverage

Status extended leverage desc

Chart titlePure SVG Cockpit

Chart subtitle

0d52d104dLegend inventory + Legend receivables50.5dLegend payables73.0dLegend inventory (46.0d)Legend receivables (4.5d)Legend payables (73.0d)Legend cash gap: -22.5d
Table titleWACC: 7.5%
Col dpo scenarioCol daysCol ap balanceCol cash impactCol cccCol annual wacc savings
-15 Days Acceleration58.0d$29,000,000-$7,500,000-7.5d-$562,500
-10 Days Acceleration63.0d$31,500,000-$5,000,000-12.5d-$375,000
-5 Days Acceleration68.0d$34,000,000-$2,500,000-17.5d-$187,500
Baseline (Current)73.0d$36,500,000—-22.5d—
+5 Days Extension78.0d$39,000,000$2,500,000-27.5d$187,500
+10 Days Extension83.0d$41,500,000$5,000,000-32.5d$375,000
+15 Days Extension88.0d$44,000,000$7,500,000-37.5d$562,500
Stat1 labelTag extended leverageStat1 desc
Stat2 label5.00 Unit timesStat2 desc
Stat3 label$36,500,000Stat3 desc

Client-Side Processing

High-performance calculation executed entirely in browser memory.

Zero Server Upload Privacy

All payloads remain strictly local with zero external server communication.

Production Ready Export

Clean, optimized output formats ready for immediate deployment.

Disclaimer text
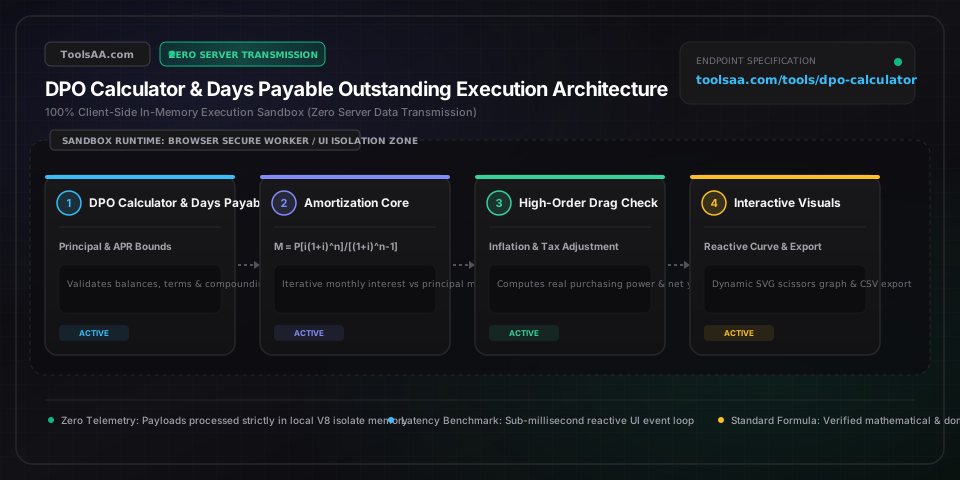
Technical Reference & Architecture Guide

DPO Calculator & Days Payable Outstanding Guide

Interactive DPO Calculator (Days Payable Outstanding & AP Turnover) with real-time client-side analysis and visualization.

DPO Calculator & Days Payable Outstanding Guide — Client-Side In-Memory Architecture & Data Flow

Key Parameters & Controls

Ending Accounts Payable (Trade Payables Balance)Balance Sheet Current Liability (USD / Reporting Currency)

Total short-term commercial obligations owed to trade vendors for raw materials, inventory, and operational supplies under GAAP ASC 210-10-45 and IFRS IAS 37. Excludes non-trade liabilities such as accrued employee compensation, tax withholdings, and long-term Capex retainage. A negative balance signifies unapplied vendor prepayments and must be reclassified to current assets.

Default: 1450000
Beginning Accounts Payable (Opening Period Trade Liability)Prior Period Balance Sheet Liability (USD / Reporting Currency)

Opening trade payables balance from the prior fiscal balance sheet, used to calculate the two-point rolling average AP [(Beginning AP + Ending AP) / 2]. Incorporating this parameter neutralizes quarterly inventory stocking distortions and eliminates executive window-dressing where vendor disbursements are delayed immediately before filing date.

Default: 1250000
Cost of Goods Sold (Annual COGS / Cost of Sales)Income Statement Operating Expense (USD / Reporting Currency)

Total direct manufacturing, inventory procurement, and freight-in expenditures recognized over the matching reporting period under GAAP ASC 330 and IFRS IAS 2. Excludes non-inventory selling, general, and administrative (SG&A) expenses and non-cash depreciation. Standard financial reporting requires COGS > 0 to prevent zero-division calculation anomalies.

Default: 8200000
Accounting Period Duration (Fiscal Calendar Days)Temporal Day Count Convention (Calendar Days)

Elapsed calendar day interval for the measured financial reporting period: 365 days for standard annual 10-K filings, 366 days for leap years, 90 to 92 days for quarterly 10-Q statements, or 30 days for monthly treasury roll-forwards. Substituting the 360-day commercial bank convention understates actual DPO by 1.37%, violating precision standards.

Default: 365

Pro Tips & Best Practices

The 2/10 Net 30 Trade Credit Trap: Why Skipping Discounts Destroys Capital

Treasury departments that stretch payments from 10 to 30 days under '2/10 Net 30' trade credit terms often mistake the extra 20 days for free vendor financing. Forfeiting a 2% early settlement discount incurs an annualized nominal APR of 37.24% [ (2 / 98) × (365 / 20) ] and a compounded Effective Annual Rate (EAR) of 44.59% [ (1 + 2/98)^(365/20) - 1 ]. Unless enterprise cost of capital exceeds 44.59%, financial best practice mandates drawing down a revolving credit line (typically 6.5%–9.0% APR) on Day 10 to capture the discount, generating an immediate risk-free spread of over 28%.

Capital Expenditure Retainage Contamination in Operating DPO

Pulling unadjusted 'Total Accounts Payable' from consolidated corporate balance sheets distorts working capital metrics if long-term property, plant, and equipment (PP&E) retainage or construction contractor payables are commingled with operating trade payables. Capex outlays flow through Cash Flow from Investing (CFI) and bypass Cost of Goods Sold on the income statement. Mixing Capex obligations into trade payables artificially inflates reported DPO by 12 to 25 days, masking deteriorating inventory velocity and misleading credit analysts.

The Hidden Margin Clawback of Unilateral Supplier Payment Extensions

Unilaterally lengthening procurement terms from Net 45 to Net 90 provides a one-time cash liquidity release [ ΔCash = ΔDPO × (COGS / 365) ], but commercial vendors systematically offset extended payment cycles by embedding a 3% to 7% financing premium into subsequent contract renewals. Over a multi-year horizon, higher gross unit costs and the loss of supplier priority allocation during inventory shortages outweigh the temporary working capital gains of prolonged DPO.

Reverse Factoring and Supply Chain Financing Reclassification Risk

Under FASB ASU 2022-04 and IFRS disclosure requirements, structured payables arrangements (reverse factoring) where financial institutions settle vendor invoices early while the corporate buyer repays the bank past 90 days must be fully disclosed in financial notes. If credit rating agencies (Moody's, S&P) reclassify these obligations from operating trade payables to short-term bank borrowings, working capital metrics will suddenly deteriorate and debt-to-EBITDA leverage ratios may trigger debt covenant review.

Eliminating Seasonal Window-Dressing via Four-Quarter Average AP

Retailers stocking inventory ahead of fourth-quarter holiday sales accumulate massive trade liabilities by late October, causing single-point ending DPO to swing upward by up to ±35 days compared to year-end troughs. Institutional equity analysts rely on a 4-quarter rolling average AP [ (AP_Q1 + AP_Q2 + AP_Q3 + AP_Q4) / 4 ] matched against Trailing Twelve Months (TTM) COGS to isolate underlying contractual terms from seasonal inventory accumulation.

Common Gotchas & Troubleshooting

⚠️DPO Produces a Mathematically Infeasible Negative Value or Extreme Outlier (>365 Days)

Verify balance sheet line items for debit balances and accounting period mismatch. Negative DPO occurs when supplier debit balances (vendor advances, return merchandise authorizations, or accrued volume rebates) exceed outstanding invoices, flipping net accounts payable negative; reclassify vendor advances to 'Other Current Assets' under GAAP ASC 340. For values >365 days, ensure quarterly COGS (e.g., $2M) was not matched against annual ending AP, which inflates DPO by 4x. Period days and COGS must cover the identical reporting duration.

⚠️AP Turnover Ratio Fluctuates Wildly After Production Outsourcing or Contract Manufacturing

Adjust for structural shifts between internal direct labor and external vendor invoicing. Moving from internal manufacturing to turnkey contract manufacturing shifts labor and factory overhead into third-party vendor invoices, increasing COGS eligible for trade payables. This causes AP turnover to drop and DPO to expand significantly, even though underlying vendor payment terms remain unchanged at Net 30. Re-baseline historical trends by segregating direct material procurement from contract assembly fees.

⚠️Cash Conversion Cycle (CCC) Appears Negative While Corporate Operating Cash Flow Contracts

Distinguish between operational efficiency and severe supplier payment distress. A negative Cash Conversion Cycle [ DIO + DSO - DPO < 0 ] typically indicates a company is funded entirely by suppliers. However, if operating cash flow is declining, the prolonged DPO likely reflects overdue invoices rather than superior trade terms. Audit the accounts payable aging schedule (specifically 60+ and 90+ days past due) and credit bureau ratings (Dun & Bradstreet Paydex). Involuntary payment delays trigger supply chain freezes and mandatory Cash-on-Delivery (COD) terms.

⚠️Discrepancy Between Bank 360-Day Convention and Fiscal 365-Day DPO Calculations

Reconcile corporate loan covenant definitions against audited GAAP/IFRS financial reports. Commercial lending syndicates frequently calculate DPO using the 360-day Count Convention [ (AP / COGS) × 360 ], which produces a DPO value 1.37% lower than the 365-day accounting standard [ 360 / 365 = 0.9863 ]. When drafting credit agreements, specify whether working capital covenants follow the actual calendar day count (365/366) or the commercial 360-day year to prevent technical covenant default.

Frequently Asked Questions

How do you calculate Days Payable Outstanding (DPO) using financial statements?▼

Days Payable Outstanding (DPO) is calculated by dividing average accounts payable by the Cost of Goods Sold (COGS) and multiplying the result by the total number of days in the accounting period: DPO = [ (Beginning AP + Ending AP) / 2 / COGS ] × Period Days. On an annual basis, ending accounts payable is taken from the current liabilities section of the balance sheet, while COGS is pulled from the income statement, using 365 calendar days (or 366 for leap years). Institutional financial analysts utilize the two-point average accounts payable rather than period-end balances to eliminate seasonal inventory stocking anomalies and fiscal year-end payment window dressing.

What is considered a good Days Payable Outstanding (DPO) benchmark by industry?▼

A healthy DPO benchmark depends entirely on industry operating dynamics, supply chain leverage, and statutory regulations. Hypermarket retail operates at 65 to 95 days (AP turnover of 3.8x to 5.6x), leveraging massive buyer dominance to run negative working capital cycles. Heavy automotive OEM operates at 55 to 80 days (4.5x to 6.6x) via tiered supply alliances. Consumer tech hardware benchmarks at 45 to 65 days (5.6x to 8.1x) due to reliance on specialized contract foundries. General construction ranges from 45 to 75 days (4.8x to 8.1x) under pay-when-paid subcontractor terms. Cloud SaaS operates at 30 to 45 days (8.1x to 12.2x) on standard corporate net 30 software terms. Food and agriculture operates at 20 to 35 days (10.4x to 18.2x) due to perishable goods velocity and legal mandates such as the US Perishable Agricultural Commodities Act (PACA).

Can a company's Days Payable Outstanding be too high, and what are the risks?▼

Yes, an excessively high DPO—typically exceeding industry medians by 20 or more days—frequently signals acute liquidity distress, cash rationing, or damaged supplier relationships rather than operational leverage. Critical operational and financial risks include: suppliers withholding raw material shipments or enforcing Cash on Delivery (COD); vendors increasing contract prices by 3% to 7% to cover their own financing costs; loss of priority allocation during supply chain shortages; and credit rating downgrades from agencies like Dun & Bradstreet (Paydex score falling below 80), Moody's, and S&P, which triggers higher borrowing spreads on corporate credit lines.

How does Days Payable Outstanding impact the Cash Conversion Cycle (CCC)?▼

Days Payable Outstanding serves as the primary cash-preserving deduction in the Cash Conversion Cycle equation: CCC = Days Inventory Outstanding (DIO) + Days Sales Outstanding (DSO) - DPO. Because DPO represents non-interest-bearing trade credit extended by suppliers, increasing DPO directly shortens the elapsed time between cash paid out for inventory and cash collected from customer receivables. When DPO exceeds the combined duration of inventory holding (DIO) and receivable collection (DSO), the Cash Conversion Cycle becomes negative, meaning the enterprise funds its day-to-day operations and growth entirely on trade vendor capital without incurring bank debt.

Should a company take a 2/10 Net 30 early payment discount or stretch DPO to 30 days?▼

A business should almost always take the 2/10 Net 30 early payment discount. Foregoing a 2% discount to defer cash payment for an additional 20 days (from Day 10 to Day 30) carries an annualized nominal borrowing cost (APR) of 37.24% [ (2 / 98) × (365 / 20) ] and an Effective Annual Rate (EAR) of 44.59%. Unless the company can invest capital in operating activities yielding greater than 44.59% per annum, skipping the prompt payment discount destroys shareholder value. The financially optimal strategy is borrowing on a short-term corporate line of credit at 6% to 9% APR to settle vendor invoices on Day 10, pocketing a net 28%+ return on the interest rate spread.

What is the difference between DPO and Accounts Payable Turnover Ratio?▼

Accounts Payable (AP) Turnover Ratio and Days Payable Outstanding (DPO) are exact mathematical reciprocals that measure commercial trade payment velocity from opposite vantage points. AP Turnover measures the frequency with which a firm pays off its average supplier commitments over a year: AP Turnover = COGS / Average Accounts Payable. DPO converts that turnover frequency into calendar days elapsed per payment cycle: DPO = 365 / AP Turnover. For example, an AP Turnover of 7.30 times per year corresponds exactly to a DPO of 50.0 calendar days (365 / 7.30), meaning the firm takes an average of 50 days to settle commercial trade invoices.

How do you calculate the working capital cash unlocked from increasing DPO?▼

Disclaimer: This tool is provided strictly for educational and informational purposes only and does not constitute formal financial advice or a binding loan commitment. Please consult a qualified financial advisor before making decisions. The cash liquidity released from extending payment terms is calculated using the working capital cash release formula: Cash Unlocked = (Target DPO - Current DPO) × (Annual COGS / 365). For example, a corporation with $365 million in annual Cost of Goods Sold operating at a current DPO of 45 days that successfully renegotiates supplier contracts to 55 days (a 10-day extension) unlocks exactly $10 million in permanent, non-debt internal liquidity [ (55 - 45) × ($365,000,000 / 365) = $10,000,000 ]. This freed cash can retire high-interest debt or fund capital expenditures without equity dilution.

Related Tools & Utilities

All Tools →
Freight Class Calculator (NMFC & Density)Utility

Calculate freight class and NMFC density instantly from pallet dimensions and weight. Estimate LTL shipping class, cubic feet, and bumping rule cost savings.

Open tool→
Cash Conversion Cycle Calculator (CCC)finance

Calculate Cash Conversion Cycle (CCC), Days Inventory Outstanding (DIO), Days Sales Outstanding (DSO), and Days Payable Outstanding (DPO). Free trapped working capital with interactive scenario modeling.

Open tool→
Safe Withdrawal Rate Calculator (FIRE & SWR)finance

Calculate safe withdrawal rates, retirement nest egg, Guyton-Klink guardrails, Trinity Study benchmarks, fee drag, and sequence of returns risk.

Open tool→
Rule of 40 Calculator (SaaS Growth & Margin)finance

Calculate your SaaS Rule of 40 score with revenue growth rate and profit margin. Benchmark against public SaaS multiples, solve target growth, and model FCF.

Open tool→
Net Revenue Retention Calculator & NDRfinance

Professional SaaS Net Revenue Retention (NRR / NDR) and Gross Revenue Retention (GRR) intelligence calculator. Models customer cohort ARR/MRR dynamics including expansion upsells, contraction downgrades, and churn cancellations. Features an ARR movement waterfall bridge, SaaS Quick Ratio efficiency rating, 5-year compounding cohort decay projection, reverse expansion target solver, and sensitivity matrix benchmarked against top-decile BVP and OpenView SaaS standards.

Open tool→
Trench Drain Calculator (Runoff & Sizing)Utility

Calculate trench drain channel size, peak storm runoff (Q=CIA), Manning flow capacity, and outlet pipe diameter with imperial and metric engineering precision.

Open tool→