DSO Calculator & Days Sales Outstanding

DSO Calculator & Days Sales Outstanding

Calculate Days Sales Outstanding (DSO), Countback True DSO, Delinquent DSO, and trapped working capital. Benchmark AR collections and model interest savings.

Btn load sample
Title control deck
Forward Analysis (Inputs → Results)
Lbl target dso30 Days
10d (Ultra-Fast)30d (Net 30)60d (Net 60)120d (Extended)
Title decision cockpit
Kpi dso
36.5days
Badge healthy
Kpi best possible dso
29.4days
Lag: 7.1d
Kpi trapped capital
$128,219.18
Run-Rate: $19,726.03/d
Kpi interest savings
$10,642.13
After-Tax: $8,407.28
Chart title ar split$ $720,000.00
80.56%In-Terms
Lbl legend in terms
$580,000.00
Lbl legend delinquent
$140,000.00
CEI Efficiency:98.08%
Chart title waterfallDays Scale (0 - 90d)
0d23d45d68d90dLbl legend terms30dLbl legend best dso29.4dLbl legend actual dso36.5dLbl legend target dso30d
Th metricTh calculatedTh assessment
Kpi dso36.5 daysBadge healthy
Kpi best possible dso29.4 daysTheoretical In-Terms Ceiling
Kpi delinquent dso7.1 daysExcessive Collection Drag
Kpi cei98.08%High Velocity Collections
Kpi ar turnover10.29xRapid Working Capital Cycle
Kpi trapped capital$128,219.18Unlockable Liquid Cash
Kpi interest savings$10,642.13/yrDirect P&L Interest Reduction
Kpi net after tax savings$8,407.28/yrNet Free Cash Flow Impact
Kpi bad debt exposure$2,100.00P&L Write-Off Reserve Requirement

Financial Modeling & Regulatory Disclosure: This enterprise treasury model provides analytical decision support based on generally accepted accounting principles (GAAP/IFRS). Calculations of Days Sales Outstanding (DSO), Collection Effectiveness Index (CEI), and implied cost of capital assume static business cycles and should not be construed as binding tax or formal audit advice. Consult with a certified treasury professional or auditor for statutory financial reporting.
Technical Reference & Architecture Guide

DSO Calculator & Days Sales Outstanding Guide

Calculate Days Sales Outstanding (DSO), Countback True DSO, Delinquent DSO, and trapped working capital. Benchmark AR collections and model interest savings.

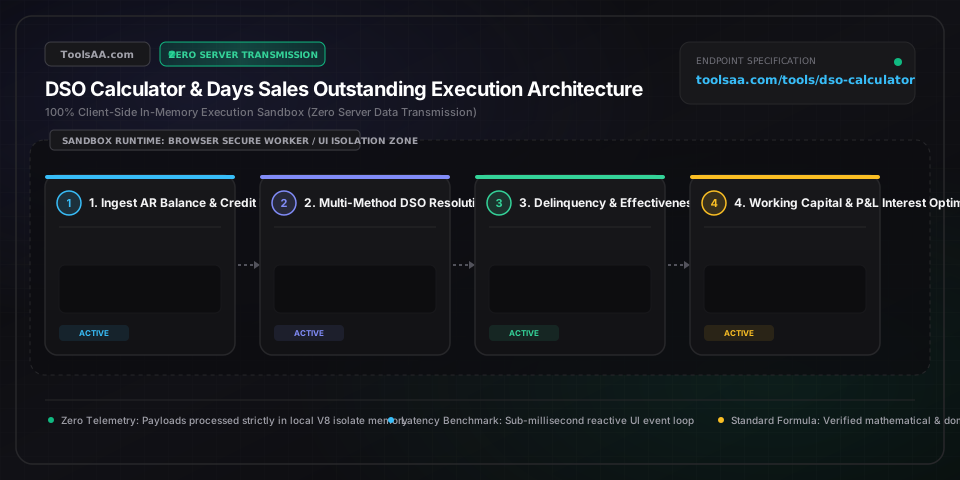
DSO Calculator & Days Sales Outstanding Guide — Client-Side In-Memory Architecture & Data Flow

Key Parameters & Controls

Ending Accounts Receivable (Gross AR)Balance Sheet Asset (Gross Book Value)

Total uncollected commercial trade invoices at period close before netting the ASC 326 Allowance for Credit Losses (CECL) or IFRS 9 impairment reserves. Excludes retention holdbacks, unbilled work-in-progress (WIP), and customer advances to avoid artificial collection velocity distortions.

Default: $1,250,000
Total Gross Credit Sales (Period Revenue)Income Statement Invoiced Revenue

Cumulative net revenue recognized strictly on open trade terms (Net 30, Net 60, etc.) over the measurement window. Excludes cash-in-advance, point-of-sale credit card settlements, and cash-on-delivery (COD) receipts, which artificially dilute the denominator and produce a deceptively low DSO reading.

Default: $10,000,000
Measurement Period HorizonStatutory Calendar Days (T)

Evaluation interval: 30 days for monthly close, 90 to 91.25 days for quarterly 10-Q SEC reporting, or 365 days for annual 10-K filings. Never substitute 250 trading or business days; working capital revolvers and commercial banking facilities accrue compounding interest on a 365-day basis.

Default: 365 Days
Current Undue Accounts Receivable (BPDSO Floor)Aging Subledger Balance (Non-Delinquent)

Portion of gross open receivables whose contractual maturity has not lapsed. Serves as the mathematical numerator for Best Possible DSO (BPDSO); subtracting BPDSO from Standard DSO isolates Delinquent DSO (DDSO), uncovering true customer default friction versus generous commercial terms.

Default: $850,000
Target DSO & Marginal Cost of Capital (Revolver APR)Treasury Benchmark & Interest Rate (%)

Internal working capital reduction objective benchmarked against Credit Research Foundation (CRF) industry upper-quartiles, paired with the marginal borrowing APR of revolving credit lines to quantify liberated liquidity (ΔWC = ΔDSO × Daily Credit Sales) and annual debt service avoidance.

Default: 35 Days @ 8.50% APR

Pro Tips & Best Practices

Benchmark Against BPDSO Floor Rather Than Nominal Stated Terms

Evaluating standard DSO solely against nominal Net 30 terms generates false operational alarms. If sales contracts contain unstandardized Net 45 and Net 60 extensions, your mathematical Best Possible DSO (BPDSO) floor might be 41.5 days. A standard DSO of 48 days represents only 6.5 days of operational collection delinquency (DDSO), not 18 days. Always decompose standard DSO into contractual baseline vs. dunning leakage before overhauling credit department workflows.

Neutralize Q4 Surges and Cyclicality via Countback Exhaustion (True DSO)

Standard period-average DSO mathematically breaks down during seasonal revenue peaks. When Q4 represents 40% of annual revenue, dividing inflated December 31 receivables by a 365-day smoothed sales average triggers a fictitious DSO spike even when every customer remits strictly on time. Treasury controllers audit cyclical businesses using the Countback Exhaustion Method, deducting prior monthly sales totals backward to isolate exact elapsed collection cycles.

Evaluate 2/10 Net 30 Discounts Against Marginal Borrowing APR

Offering standard 2/10 Net 30 trade discounts carries an annualized effective cost of capital of 36.73% [((1 + 2/98)^(365/20)) - 1]. If corporate revolving credit lines or asset-backed facilities carry an 8.5% borrowing APR, offering early payment discounts across all accounts destroys net operating margins. Restrict dynamic discounts strictly to chronic late-payers or high credit-risk commercial accounts.

Implement Automated Dunning Triggers Prior to the Day +60 Default Cliff

Commercial credit default curves demonstrate that accounts passing 60 days past due experience an immediate 30% reduction in unassisted collectability, degrading further to a 50%+ loss expectancy past 90 days. Configure automated ERP workflows to execute tiered notifications: a soft invoice statement at Day -3, a maturity notice at Day 0, an automated finance fee alert at Day +1, and direct credit-hold escalation at Day +15.

Isolate Disputed Invoices into Segregated Escrow Subledgers

Billing errors, delivery quantity disputes, and unapplied customer credit memos left in active aging buckets distort operational metrics. Park disputed receivables into a segregated administrative adjustment subledger. This ensures your Collection Effectiveness Index (CEI) and Delinquent DSO accurately evaluate collector performance without penalizing treasury teams for fulfillment errors.

Common Gotchas & Troubleshooting

⚠️DSO is mathematically lower than contractual payment terms (Negative Delinquent DSO / DDSO < 0)

A negative Delinquent DSO indicates that Current Undue AR exceeds Total Gross Ending AR, or substantial unapplied customer cash deposits, credit memos, and prepayments are improperly netting down the AR control account. Perform a subledger scrub to match unallocated cash receipts to open invoices, remove unearned prepayments, and verify that gross receivables reflect strictly outstanding billed debtor balances.

⚠️Countback True DSO fails to exhaust ending accounts receivable across historical quarters

Ending receivables exceed cumulative multi-month revenue, signifying chronic legacy delinquency (>180 days past due) or severe structural revenue deceleration. Expand your historical monthly sales intake array from 4 months to 12 months, and conduct an impairment assessment under ASC 326 (CECL) to write off uncollectible debt against the Allowance for Credit Losses.

⚠️Severe DSO inflation in December despite 98% on-time customer settlement

Standard DSO divides point-in-time year-end AR by a 365-day smoothed sales average, creating an artificial denominator mismatch during holiday or fiscal year-end sales rushes. Switch the calculator methodology to the Countback Exhaustion Method or compute a rolling 90-day quarterly DSO: (Ending AR ÷ Q4 Credit Sales) × 91.25.

⚠️Customer Aging Schedule bucket totals do not balance with Total Gross Ending AR

Discrepancies occur when unposted billing batches, unassigned journal entries, or disputed credit holds exist in the general ledger (GL) without corresponding subledger allocations. Execute an AR subledger-to-GL reconciliation: verify that the sum of Current + 1-30 + 31-60 + 61-90 + 90+ days past due matches General Ledger Account 1100 exactly.

Frequently Asked Questions

How to calculate DSO with the standard formula vs countback method?▼

Standard DSO is calculated as (Ending Accounts Receivable ÷ Total Credit Sales) × Measurement Days (30, 90, or 365), measuring the macro average days to collect. The Countback (True DSO) method eliminates seasonal distortions by working backward through historical monthly sales: deducting each preceding month's full credit sales from ending AR and accumulating calendar days until remaining receivables are less than that month's revenue, adding (Unexhausted AR ÷ Month's Credit Sales) × Days in that Month.

What is a good Days Sales Outstanding (DSO) benchmark by industry?▼

A healthy DSO typically sits within 33% to 45% above stated contractual credit terms; for standard Net 30 contracts, a DSO between 30 and 42 days represents top-quartile performance. Cross-industry benchmarks established by the Credit Research Foundation indicate: Enterprise SaaS operates at 35 to 45 days; Wholesale Distribution averages 40 to 55 days; Capital Equipment & Manufacturing ranges from 55 to 70 days; and Commercial Construction spans 75 to 95+ days due to multi-tier pay-when-paid clauses and retention holdbacks.

What is the difference between DSO and Best Possible DSO (BPDSO)?▼

Standard DSO evaluates total outstanding receivables (both current and past due), whereas Best Possible DSO (BPDSO) measures only current, non-delinquent invoices via the formula: (Current Undue AR ÷ Total Credit Sales) × Period Days. The variance between the two constitutes Delinquent DSO (DDSO = Standard DSO - BPDSO); if your standard DSO is 54 days and BPDSO is 33 days, your contractual terms are sound, but operational dunning inefficiency is leaking 21 days of balance sheet liquidity.

How does reducing DSO increase cash flow and trapped working capital?▼

Reducing DSO accelerates balance sheet liquidity according to the formula: Freed Working Capital = (Prior DSO - Target DSO) × (Annual Credit Sales ÷ 365). For an enterprise with $25,000,000 in annual credit billings, shaving 6 days from DSO unlocks $410,959 in immediate operating cash flow; deployed against an 8.5% revolving line of credit, this yields $34,931 in direct, pre-tax annual debt service interest savings.

Why does standard DSO spike during seasonal Q4 sales rushes?▼

Standard DSO spikes during Q4 surges because point-in-time ending receivables reflect peak seasonal billings, while the denominator divides by the entire year's lower daily average sales. For example, if a firm earns 45% of annual revenue in November and December, standard 365-day DSO will artificially register 60+ days even if every customer pays precisely on Net 30 terms, necessitating a 90-day rolling DSO or Countback calculation.

How do you calculate Delinquent DSO (DDSO) and Collection Effectiveness Index (CEI)?▼

Disclaimer: This tool is provided strictly for educational and informational purposes only and does not constitute formal financial advice or a binding loan commitment. Please consult a qualified financial advisor before making decisions. Delinquent DSO is calculated as DDSO = Standard DSO - Best Possible DSO, or (Overdue Past Due AR ÷ Total Credit Sales) × Period Days, isolating late payment friction. In contrast, the Collection Effectiveness Index measures operational efficiency independent of sales volume fluctuations using the formula: CEI = [((Beginning AR + Credit Sales) - Ending AR) ÷ ((Beginning AR + Credit Sales) - Current Undue AR)] × 100, where a rating above 85% denotes high collection rigor.

Related Tools & Utilities

All Tools →