Elasticsearch Shard & Cluster Calculator

Elasticsearch Shard & Cluster Calculator

Calculate Elasticsearch shard counts and cluster sizing. Estimate primary and replica storage, node RAM, JVM heap limits, and disk watermark safety thresholds.

Load Example
Lbl primary storage9.92 TB
Lbl total disk24.80 TB
Lbl active shards398
Lbl recommended data nodes7 Nodes
Lbl master quorum3 Dedicated
Lbl heap shard health9%
Title workload architecture

Time-series telemetry, container logs, and system metrics with ILM rollover and 1 replica.

250.0 GB / day
30 Days
Lbl indexing overhead:+15%
Peak Burst:+15%
Lbl watermark buffer:20%
Title hardware node specs
64 GB RAM
Lbl jvm heap ratio:31 GB Heap / 33 GB OS Cache

Compressed OOPs Enabled (< 31 GB): Hint compressed oops

4.0 TB (4,000 GB)
20 shards / GB
10 (Conservative)20 (Official Default)25 (Aggressive)
Title reverse capacity solver

Desc reverse capacity solver

Max Safe Daily Ingestion278.3 GB / dayBottleneck: Disk Space
Max Shards Allowed3,7201,860 Primaries
Max Retention (Current Load)33 Days@ 250 GB/d
Cluster DimensionCalculated Metric
Lbl primary storage9.919 TB (9,918.8 GB)
Lbl replicated storage19.838 TB
Lbl total disk with headroom24.797 TB
Lbl recommended shards199 Primaries (398 Active)
Lbl recommended data nodes7 Nodes
Lbl master quorum3 Dedicated Master Nodes
Coordinating Ingest NodesShared with Data
Title cluster topology svg7 Data + 3 Master
DEDICATED MASTER QUORUM (Split-Brain Immune)master-01master-02master-03data-01SHARDSPR~57 shards9% densityHEAP 31GDISK 4.0Tdata-02SHARDSPR~57 shards9% densityHEAP 31GDISK 4.0Tdata-03SHARDSPR~57 shards9% densityHEAP 31GDISK 4.0Tdata-04SHARDSPR~57 shards9% densityHEAP 31GDISK 4.0Tdata-05SHARDSPR~57 shards9% densityHEAP 31GDISK 4.0Tdata-06SHARDSPR~57 shards9% densityHEAP 31GDISK 4.0Tdata-07SHARDSPR~57 shards9% densityHEAP 31GDISK 4.0T
CLUSTER HEALTH: OPTIMAL
Nodes: 7Shards: 398Disk: 24.80 TB
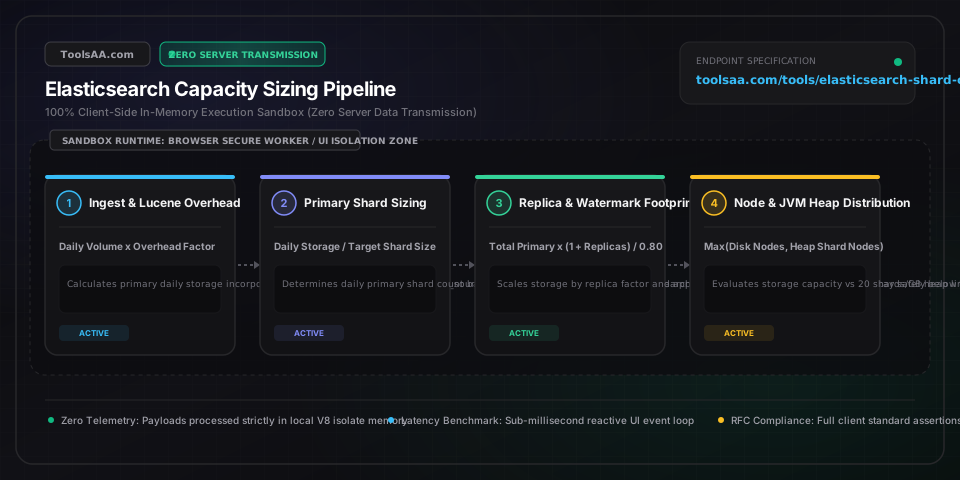
Technical Reference & Architecture Guide

Elasticsearch Shard & Cluster Calculator Guide

Calculate Elasticsearch shard counts and cluster sizing. Estimate primary and replica storage, node RAM, JVM heap limits, and disk watermark safety thresholds.

Elasticsearch Shard & Cluster Calculator Guide — Client-Side In-Memory Architecture & Data Flow

Key Parameters & Controls

Daily Ingestion VolumeGigabytes per day (GB/day)

Raw uncompressed document volume indexed into Elasticsearch per 24-hour cycle before Lucene expansion.

Default: 100 GB/day
Primary Shard Target SizeGigabytes per shard (GB)

Gold benchmark: 10 GB to 30 GB for search workloads; 30 GB to 50 GB for time-series log and metrics analytics. Exceeding 50 GB risks lengthy shard recovery and rebalance timeouts.

Default: 50 GB
Replica Count (number_of_replicas)Integer replica copies

Number of redundant copies per primary shard. Value of 1 provides high availability against single-node failure and doubles read capacity; 2 replicas protects against concurrent dual-node failures.

Default: 1
JVM Heap AllocationGigabytes RAM (GB)

Standard 50% rule assigns half physical node RAM to the JVM heap and reserves 50% for OS filesystem cache (Lucene mmapfs). Must strictly never exceed 31 GB to maintain Compressed Ordinary Object Pointers (Compressed OOPs).

Default: 31 GB
Shard-to-Heap RatioShards per GB of JVM heap

Official Elastic architectural ceiling is 20 shards per 1 GB of JVM heap (e.g. 30 GB heap supports up to 600 shards). Production conservative benchmark is 10 to 15 shards/GB to avoid segment metadata heap exhaustion.

Default: 20 shards/GB
Disk Watermark Safety BufferPercentage headroom (%)

Unallocated disk margin ensuring node usage remains safely below the 85% low watermark (stops allocating new shards) and 90% high watermark (triggers active shard relocation).

Default: 20%

Pro Tips & Best Practices

The 31 GB Compressed OOPs Threshold Cliff

Never set ES_JAVA_OPTS heap allocation to 32 GB or higher. At or above approximately 31.5 GB, the JVM switches from 32-bit compressed object pointers (Compressed OOPs) to 64-bit uncompressed pointers. This immediately consumes roughly 40% more memory for the exact same object references, meaning a 32 GB heap actually provides significantly less usable memory than a 31 GB heap.

Rollover API vs Daily Index Oversharding

Avoid rigid date-based index patterns like logstash-YYYY.MM.DD with static shard counts. Small days create tiny 100 MB shards while spike days create monster 80 GB shards. Use Index Lifecycle Management (ILM) with the Rollover API configured to 'max_primary_shard_size: 50gb' or 'max_age: 30d' to guarantee uniform shard sizes and eliminate oversharding.

Lucene Segment Cache 50% Rule

Never allocate more than 50% of total system RAM to the Elasticsearch JVM heap. Lucene depends heavily on the underlying Linux OS page cache to keep index segment files, inverted indices, and doc_values in memory. Starving the OS cache causes heavy disk read I/O, spiking query latencies and garbage collection pause times.

Dedicated Master Quorum Formula

For clusters with 6 or more nodes or business-critical workloads, run exactly 3 dedicated master-eligible nodes (configured with node.roles: [master]). This satisfies the quorum formula (N / 2) + 1 = 2 votes to prevent split-brain partitions without wasting high-cost storage or compute on master duties.

Common Gotchas & Troubleshooting

⚠️Cluster Turns Red or Yellow with UNASSIGNED Shards

Check GET _cluster/allocation/explain. The two most common causes are: (1) Disk usage on a data node crossed the 85% low watermark, preventing Elasticsearch from placing replica shards; (2) number_of_replicas is set equal to or higher than total data node count. Lower replica count or increase storage.

⚠️Cluster Locked in Read-Only Mode at 95% Flood Stage

When any data node hits the 95% flood stage watermark, Elasticsearch automatically enforces cluster.blocks.read_only_allow_delete: true on all indices. Delete indices or expand disks, then run PUT */_settings with {'index.blocks.read_only_allow_delete': null} to restore write operations.

⚠️CircuitBreakingException [parent] Data Too Large on JVM

This error occurs when memory tracking for parent circuits exceeds 95% of heap. Caused by high segment count from oversharding, un-pruned fielddata on text fields, or massive aggregation buckets. Consolidate small indices using _forcemerge?max_num_segments=1 on read-only indices and reduce total active shard count.

Frequently Asked Questions

How do I calculate shard size in Elasticsearch?▼

Primary shard size equals (Daily Ingest Volume in GB * (1 + Indexing Overhead Multiplier)) divided by the number of primary shards. In production, measure actual disk usage via GET _cat/shards?v&h=index,shard,prirep,store to observe real-world disk footprint including doc_values and segment metadata.

What is the maximum recommended shard size for Elasticsearch?▼

The official maximum recommendation is 50 GB per shard for time-series logging, metrics, and security events, and 20 GB to 30 GB for low-latency search catalogs. Shards exceeding 65 GB suffer from severe Lucene segment merge overhead, prolonged cluster rebalancing, and slow snapshot restorations.

How many shards should I have per GB of heap?▼

Maintain a strict maximum of 20 shards per 1 GB of configured JVM heap. A node configured with the standard 30 GB heap ceiling can safely support up to 600 total shards (including primary and replica shards). Operating above 20 shards/GB risks cluster-wide instability and out-of-memory crashes due to segment memory overhead.

Primary shards vs replica shards what is the difference?▼

Primary shards are the original partitions holding indexed documents where write operations are first processed. Replica shards are exact synchronous duplicates of primary shards that provide hardware fault tolerance (high availability) and scale read search throughput across multiple nodes. Replicas never reside on the same physical node as their corresponding primary shard.

Why is my Elasticsearch cluster in red status due to unassigned shards?▼

Red status indicates that one or more primary shards cannot be allocated to any node, causing immediate data unavailability. This commonly happens if the disk crossed the 95% flood stage watermark, if a host holding un-replicated primary shards crashed, or if corrupted Lucene segment files exist on disk. Run GET _cluster/allocation/explain to identify the exact blocking reason.

Related Tools & Utilities

All Tools →
Connection Pool Calculator & DB SizingDeveloper

Production-grade database connection pool calculator and capacity planning workbench. Accurately calculate optimal pool sizes per Kubernetes pod, prevent thread thrashing, estimate queue wait times, and safeguard database memory against out-of-memory crashes using Little's Law, HikariCP core saturation formulas, and PgBouncer transaction multiplexing ratios.

Open tool→
API Rate Limit Calculator & Token BucketDeveloper

Interactive API Rate Limit Calculator (Token Bucket & RPS) with real-time client-side analysis and visualization.

Open tool→
Resistor Color Code Calculator & DecoderDeveloper

Calculate 3, 4, 5, and 6-band resistor color codes with instant bidirectional decoding, tolerance envelopes, temperature coefficient drift, reverse E-series value synthesis, and SMD equivalents per IEC 60062.

Open tool→
RabbitMQ Queue Memory & Throughput SizerDeveloper

Interactive RabbitMQ Queue Memory & Throughput Calculator with real-time client-side analysis and visualization.

Open tool→
PostgreSQL Memory Calculator & PGTune ConfigDeveloper

Calculate PostgreSQL memory settings & generate PGTune postgresql.conf parameters. Optimize shared_buffers, work_mem, effective_cache_size, and max_connections.

Open tool→
RAID Capacity Calculator & ZFS ToolDeveloper

Calculate usable storage capacity in decimal TB and binary TiB across RAID 0, 1, 5, 6, 10, 50, 60, and ZFS RAIDZ1/Z2/Z3 arrays with parity overhead, URE rebuild crash risk, rebuild duration, and drive bay visualizer.

Open tool→