ROI & Annualized Return Calculator

ROI & Annualized Return Calculator

Calculate return on investment (ROI) and annualized ROI (CAGR) instantly. Compare net profit, investment length, inflation drag, and target gain milestones.

Presets label
USD ($)
$25,000
$

Hint initial investment

$41,250
$

Hint final value

$0
$

Hint recurring inflows

2.5%

Hint inflation rate

15%

Hint tax rate

Kpi net profit$16,2501.65x Kpi moic
Kpi simple roi+65.00%Kpi nominal gain
Kpi cagr+10.53%Kpi geometric growth
Kpi doubling time6.8 Unit yearsKpi years to double
Chart title
Chart nominal legendChart real legendChart cost basis legend
$43,312.5$22,5000Unit years short5.0Unit years short

Chart subtitle

Kpi moic1.65x
Legend cost basis
61% ($25,000)
Legend spendable alpha
21% ($9,021.49)
Legend tax drag
6% ($2,437.5)
Legend inflation drag
12% ($4,791.01)

Disclaimer text

Primary Metric$34,021.49Kpi real roi: +45.84%
Efficiency / Capacity+10.53%Kpi after tax roi: +55.25%
Net OutputLbl client sideLbl engine latency
Client-Side Processing

High-performance calculation executed entirely in browser memory.

Zero Server Upload Privacy

All payloads remain strictly local with zero external server communication.

Production Ready Export

Clean, optimized output formats ready for immediate deployment.
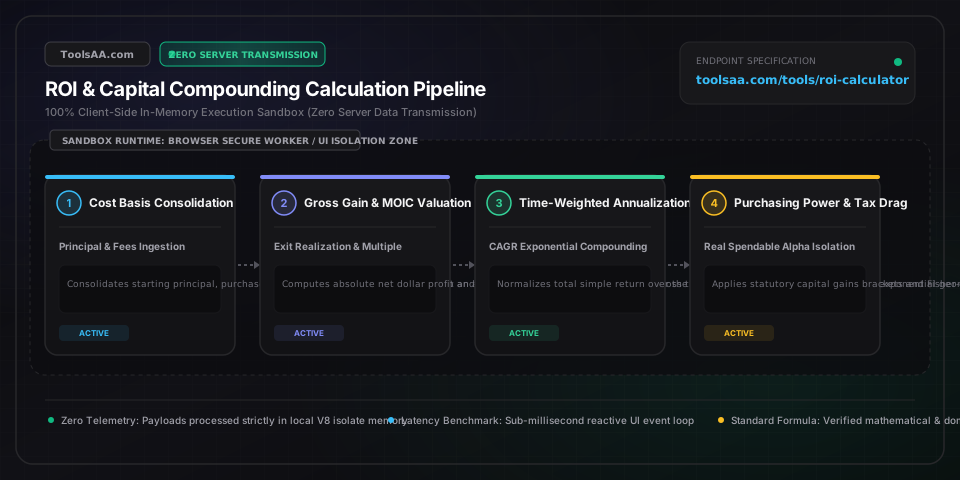
Technical Reference & Architecture Guide

ROI & Annualized Return Calculator Guide

Calculate return on investment (ROI) and annualized ROI (CAGR) instantly. Compare net profit, investment length, inflation drag, and target gain milestones.

ROI & Annualized Return Calculator Guide — Client-Side In-Memory Architecture & Data Flow

Key Parameters & Controls

Initial Cost Basis (Capital Outlay)Currency Amount ($ / € / £ / ¥)

Total cumulative cash invested, including brokerage transaction commissions, origination fees, and upfront legal closing expenses. Must strictly exceed zero.

Default: $25,000
Terminal Valuation (Gross Exit Value)Currency Amount ($ / € / £ / ¥)

Final realized cash proceeds upon asset divestiture, gross revenues generated, or current mark-to-market portfolio value before deducting taxes and distributions.

Default: $41,250
Holding Period HorizonDecimal Years / Normalized Months

Precise duration between capital deployment and liquidity exit. Horizon length dictates whether Simple ROI or Compound Annualized Return (CAGR) serves as the primary evaluation benchmark.

Default: 5.0 Years
Macro Inflation Drag & Tax WithholdingAnnual Percentage Rates (%)

Statutory capital gains tax withholding (15% to 25% depending on jurisdiction) paired with prevailing CPI inflation rate (historical 2.0% to 3.5% central bank target) determining real spendable wealth creation.

Default: 2.5% Inflation, 15% Tax

Pro Tips & Best Practices

The Short-Horizon Annualization Distortion

Never extrapolate sub-annual trades into annualized returns without caution. Generating a 10% gain over 10 days produces an astronomical theoretical CAGR exceeding 3,000%, which is mathematically valid but operationally unrepeatable across a full fiscal year.

The Math Asymmetry of Drawdown Recovery

Percentage gains and losses are non-linear. A 50% capital drawdown requires a 100% subsequent ROI on remaining capital just to restore the initial principal break-even point, while an 80% loss demands a 400% ROI to recover.

Nominal Mirage vs Purchasing Power Reality

A positive nominal ROI can mask real capital destruction. A 15% cumulative return earned across 4 years with average annual inflation at 4% yields a net negative real return, eroding actual purchasing power despite reporting an accounting profit.

Multiple on Invested Capital (MOIC) vs IRR Nuance

MOIC measures total cash-on-cash multiple regardless of time, whereas annualized ROI (CAGR) penalizes sluggish capital velocity. A 2.0x return over 2 years generates a stellar 41.4% CAGR, while the same 2.0x return dragged over 10 years produces an ordinary 7.2% CAGR.

Common Gotchas & Troubleshooting

⚠️Negative ROI & Total Loss Boundary Handling

When terminal asset valuation drops below initial cost basis, Net Profit turns negative and ROI displays between 0% and -100%. In worst-case insolvencies where the asset goes to zero, the maximum downside loss is capped at -100% (unless shorting or leveraged with margin debt).

⚠️Sub-Day Holding Periods Triggering Math Overflow

When calculating CAGR with holding periods under 0.01 years (less than 4 days), exponential power formulas (1/t) can produce numeric overflow or infinity. The calculation engine automatically locks annualized metrics and falls back to absolute Simple ROI for ultra-short horizons.

⚠️Hidden Recurring Carrying Costs Omission

Users frequently overestimate property or business ROI by omitting ongoing property taxes, insurance, software licensing, and marketing maintenance. Always sum total lifetime cash outlays into the initial cost basis input to obtain genuine net return figures.

Frequently Asked Questions

How do you calculate return on investment (ROI)?▼

Simple ROI is calculated by subtracting the initial cost basis from the final realized value to determine net profit, dividing net profit by the initial cost basis, and multiplying by 100 to yield a percentage. For example, if you invest $10,000 and sell for $13,500, your net profit is $3,500, giving an ROI of ($3,500 / $10,000) * 100 = 35%.

What is the difference between simple ROI and annualized ROI?▼

Simple ROI measures absolute total percentage gain from start to finish regardless of time duration, making a 50% gain over 1 year look identical to a 50% gain over 10 years. Annualized ROI (Compound Annual Growth Rate or CAGR) normalizes returns into an equivalent compound annual rate using the formula [(Final Value / Initial Value)^(1 / Years)] - 1, enabling fair apples-to-apples comparisons between investments with differing holding periods.

What is considered a good ROI on an investment?▼

A good ROI depends heavily on asset class risk and time horizon. Historically, the broad US stock market (S&P 500) has delivered an average nominal annualized return of approximately 10% (around 7% after inflation). For conservative fixed income (Treasuries, CDs), 4% to 5% is standard, while private real estate targets 12% to 18% annualized returns to compensate for illiquidity, active management, and leverage risk.

How do inflation and capital gains taxes affect real ROI?▼

Disclaimer: This tool is provided strictly for educational and informational purposes only and does not constitute formal financial advice or a binding loan commitment. Please consult a qualified financial advisor before making decisions. Taxes and inflation create significant drag on gross returns. Capital gains tax reduces realized net profit by 15% to 25% upon liquidation, after which continuous macroeconomic inflation erodes the remaining capital's purchasing power. Using the Fisher equation, if your nominal annual return is 8%, inflation is 3%, and tax is 20%, your net after-tax nominal return is 6.4%, leaving an actual real purchasing power increase of only approximately 3.3% per year.

Related Tools & Utilities

All Tools →