Kanban Bin & Reorder Point Calculator

Kanban Bin & Reorder Point Calculator

Calculate optimal Kanban bin sizing, two-bin reorder points, and safety stock. Simulate lead time demand, inventory turns, and container capacity instantly.

Lbl select preset:
Lbl architecture model
Sec demand lead
1,200 Lbl units
Lbl total lead time:3.00 Lbl days
Lbl vendor lead time
Lbl transit days
Lbl internal review days
Sec container safety
500 Lbl units
20%
Sec financials cost
Kpi total bins
9
Kpi total bins sub
Kpi reorder point
4,365
Kpi reorder point sub
Kpi safety stock
728
Kpi safety stock sub
Kpi cycle interval
0.4Lbl days
3 Lbl hours / Lbl bin
Lbl sawtooth title
Lbl peak stockLbl rop triggerLbl safety floor
Lbl safety floor: 728 Lbl unitsKpi reorder point: 4,365 Lbl unitsLbl peak stock: 4,500 Lbl unitsLbl timeline days →Lbl units axis ↑
Lbl formula proof title
Lbl step1

D_eff = 1200 / (1 - 0.010) = 1212.1 Lbl units/Lbl days

Lbl step2

L = 2 + 0.5 + 0.5 = 3.00 Lbl days

Lbl step3

SS = D_eff * L * 20% = 728 Lbl units

Lbl step4

ROP = (D_eff * L) + SS = 3636 + 728 = 4365 Lbl units

Lbl step5

K = ceil[ (D_eff * L + SS) / C ] = ceil[ (3636 + 728) / 500 ] = ceil[8.73] = 9 Lbl bins (Lbl min required: 2 - two_bin)

Stat effective pull1212.1 Lbl units/Lbl days
Stat working capital$810.00
Stat bin gross weight42.2 lbs

Client-Side Processing

High-performance calculation executed entirely in browser memory.

Zero Server Upload Privacy

All payloads remain strictly local with zero external server communication.

Production Ready Export

Clean, optimized output formats ready for immediate deployment.
Technical Reference & Architecture Guide

Kanban Bin & Reorder Point Calculator Guide

Calculate optimal Kanban bin sizing, two-bin reorder points, and safety stock. Simulate lead time demand, inventory turns, and container capacity instantly.

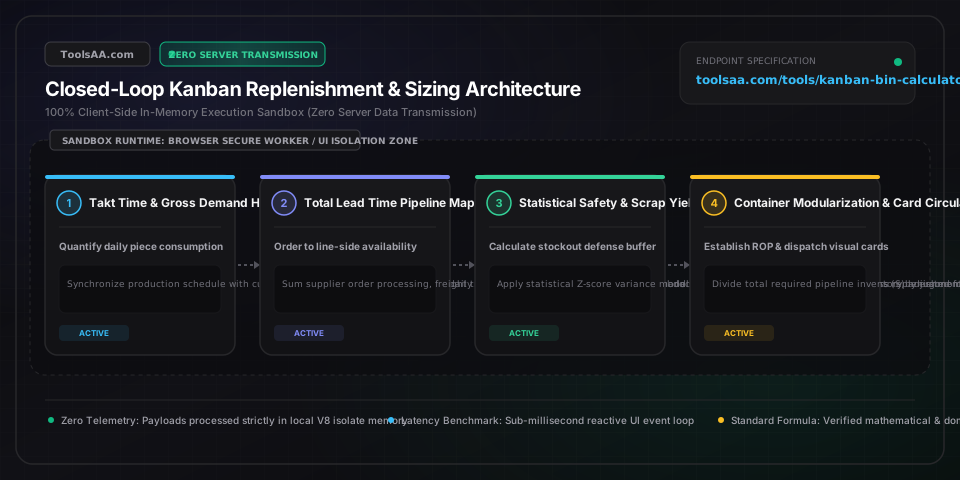
Kanban Bin & Reorder Point Calculator Guide — Client-Side In-Memory Architecture & Data Flow

Key Parameters & Controls

Average Daily Consumption Rate (D)pieces per working day

Expected units consumed per operational day. Calculated by dividing weekly gross requirements by scheduled working days or derived from customer takt time (D = Available Operating Seconds / Takt Time).

Default: 1200
Total Replenishment Lead Time (L)decimal business days

Total elapsed time from physical Kanban card trigger / bin scan to line-side availability: Supplier Processing Time + Logistic Transit Duration + Receiving Dock Inspection & Putaway.

Default: 3.0
Container / Bin Usable Capacity (C)units per container

Quantity of parts held in a single physical container. Governed by supplier packaging pack-out counts, inner carton multiples, and manual lifting safety limits (typically keeping total weight under 35 lbs / 15 kg).

Default: 500
Safety Buffer Factor (S)percentage cushion

Lean production safety cushion multiplier (standard range 15% to 40%) applied to cover micro-stoppages, transit congestion, and seasonal demand variance without maintaining bloated buffer stock.

Default: 20
Statistical Service Level (Z)standard normal distribution score

Stockout prevention confidence level. Standard manufacturing benchmarks: 95% (Z = 1.65) for non-critical hardware; 99% (Z = 2.33) for automated assembly line parts; 99.9% (Z = 3.09) for sterile medical and aerospace assemblies.

Default: 95
Operational Scrap & Defect Ratepercentage yield loss

Historical percentage of parts scrapped during assembly, line setup, or transport damage. The formula adjusts card counts upward by 1 / (1 - ScrapRate) to prevent premature stockouts.

Default: 1.0

Pro Tips & Best Practices

Avoid the Half-Bin Trigger Trap in 2-Bin Pull

In a strict two-bin system, never trigger the replenishment order when a bin is half-full. The trigger card MUST be dispatched the exact moment the first bin is entirely empty. Triggering on partial bins introduces erratic lead time tracking, invalidates card counts, and creates unrecorded phantom inventory on the shop floor.

Enforce Strict Container Tare & Ergonomic Limits

Never size a bin solely by mathematical lot formulas. An optimal 1,000-piece container calculation is unusable if gross weight exceeds 35 lbs (15 kg), which violates OSHA manual material handling guidelines and forces two-person lifts. Cap bin capacity C by the ergonomic threshold: C_max = floor((35 lbs - TareWeight) / UnitWeight).

Account for Supplier Minimum Order Quantity (MOQ) Friction

If a supplier requires a 2,000-unit MOQ but your optimal Kanban bin capacity is 250 units, do NOT increase your line-side bin size to 2,000. Instead, establish an internal central-stores staging buffer: line-side operates on eight 250-unit pull cards, while the supplier replenishment triggers only when a batch of 8 cards accumulates in the central staging queue.

Audit Physical Card Circulation Against Electronic Scans

The leading cause of Kanban stockouts in hybrid factories is 'lost card friction'—operators failing to drop physical laminate cards into collection boxes when opening a new bin. Always implement barcode verification at the drop mailbox and run weekly card audits where Total In-Circulation Cards = Active Full Bins + Staged Bins + Purchase Orders in Pipeline.

Common Gotchas & Troubleshooting

⚠️Line-side stockout occurs despite calculator showing safe 20% buffer

Audit the actual dock-to-line putaway delay. Calculations often assume transit ends when the truck arrives at the factory gate, overlooking 12 to 36 hours of receiving backlog, quality quarantine, and forklift queue times. Add measured internal dock-to-point-of-use time directly into Total Lead Time (L).

⚠️Calculated number of Kanban bins yields an unmanageable fraction

Always apply the mathematical ceiling function ceil() to the final card count, never standard rounding round(). Rounding down (e.g., 3.2 bins rounded down to 3) mathematically removes your safety stock and guarantees a stockout during any lead time delay. If rounding up to 4 creates excess inventory, reduce container capacity C or negotiate shorter supplier review cycles.

⚠️Severe bin overflow and insufficient rack space during low-demand periods

Your Kanban card count was sized for peak seasonality. In Lean manufacturing, Kanban cards must be dynamic. During planned model changeovers or seasonal demand dips, management must physically remove cards from circulation ('freezing cards') to shrink pipeline stock proportionally to reduced daily demand.

⚠️Frequent false replenishment triggers caused by variable piece weights

When using scale-based weight sensors to trigger automatic electronic Kanban replenishment, tare weight accumulation from dust, oil residue, or cardboard liner variations can simulate empty conditions. Calibrate zero-tare baselines weekly and set trip thresholds at 95% empty rather than absolute zero.

Frequently Asked Questions

How do you calculate the number of Kanban bins?▼

The standard Toyota Production System (TPS) Kanban formula is: Number of Bins (K) = ceil([D * L * (1 + S/100)] / C), where D is Average Daily Consumption, L is Total Replenishment Lead Time in days, S is the Safety Stock percentage, and C is the Usable Container Capacity. For example, with daily demand of 500 parts, a 2-day lead time, a 20% safety buffer, and 400-part bins: K = ceil([500 * 2 * 1.20] / 400) = ceil(1200 / 400) = 3 bins in total circulation.

What is the difference between a 2-bin and 3-bin Kanban system?▼

A 2-bin system uses two identical containers at the point of use: the operator works exclusively out of Bin 1; when Bin 1 empties, it is sent for replenishment while the operator switches to Bin 2, requiring that replenishment lead time is strictly shorter than the time to consume one full bin. A 3-bin system adds a dedicated intermediate buffer: Bin 1 is active at the work cell, Bin 2 is in factory line-side reserve/staging, and Bin 3 is in transit from the external vendor, providing resilience for longer external supplier lead times.

How do you determine safety stock for a Kanban container?▼

Safety stock can be set using a Lean percentage factor (typically 10% to 30% of lead time demand) or through statistical standard deviation for variable environments: Safety Stock = Z * sqrt(L * σ_d^2 + D^2 * σ_l^2), where Z is the normal distribution factor (1.65 for 95% service level, 2.33 for 99%), L is lead time, D is average daily demand, σ_d is demand standard deviation, and σ_l is lead time standard deviation. Statistical sizing prevents over-buffering predictable parts while protecting against volatile supply lines.

What causes a Kanban pull system to fail or run out of stock?▼

The three primary failure modes are: 1) Card discipline breakdown, where physical Kanban cards are lost, delayed in operator pockets, or not scanned immediately upon opening a new container; 2) Unmeasured lead time creep, where supplier delays or internal receiving backlogs lengthen actual lead time beyond the formula's parameter L; and 3) Batching violations, where material handlers hold replenishment signals until a 'full pallet' accumulates rather than dispatching orders according to the pull trigger.

Related Tools & Utilities

All Tools →