All Tools
Sales Commission Calculator & OTE Planner

Sales Commission Calculator & OTE Planner

Calculate sales commission, tiered quota accelerators, and OTE earnings. Real-time calculator for flat rates, gross margin splits, draws, and team payouts.

Lbl presets bar
Title control deck
USD
Sec deal financials
$1,300,000
$
$1,000,000
$
$100,000
$
Sec quota tiers
#1
%
#2
%
#3
%
Sec draw and splits
100%
10% (Hint desk team heavy)100% (Hint solo rep)
$0
$
Sec advanced tax and period
32%
Hint supplemental tax
Lbl cap switch
Title decision cockpit
Kpi gross commission$150,000.00Lbl company wide
Kpi net take home$250,000.00Lbl base plus commission
Kpi effective rate11.54%Lbl of revenue
Kpi post tax est$170,000.00-32% Lbl after tax drag
130.0%Lbl quota progress
Lbl gross sales vol$1,300,000.00
Lbl quota base$1,000,000.00
Lbl rep split payout$150,000.00 (100%)
Lbl draw deficit status$0.00
Lbl comp breakdown title$250,000.00 Lbl total
Lbl base portion:$100,000
Lbl variable portion:$150,000
Lbl tax portion:-$80,000
Lbl target o t e
$200,000
Lbl at plan quota
Lbl quota multiple
5.0x
Lbl benchmark4 to6
Lbl pay mix benchmark
50 / 50
Lbl standard mix
Title compensation ledger
Lbl guaranteed salary$100,000.00
Lbl earned gross rep$150,000.00
Lbl clawbacks subtracted-$0.00
Lbl draw offset applied$0.00
Primary Metric130.00%
Efficiency / Capacity$250,000.00
Net Output11.54%
Disclaimer title

Disclaimer text

Technical Reference & Architecture Guide

Sales Commission Calculator & OTE Planner Guide

Calculate sales commission, tiered quota accelerators, and OTE earnings. Real-time calculator for flat rates, gross margin splits, draws, and team payouts.

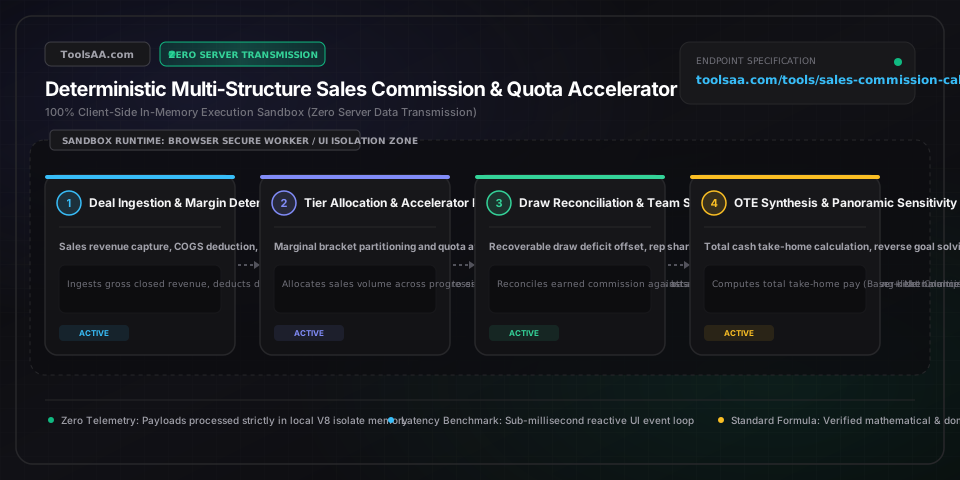
Sales Commission Calculator & OTE Planner Guide — Client-Side In-Memory Architecture & Data Flow

Key Parameters & Controls

sales_revenue_volumeMonetary Currency Amount ($ / £ / € / ¥)

Gross recognized revenue, closed Annual Contract Value (ACV/ARR), or net invoice billings booked during the performance measurement cycle. Evaluated against ASC 606 revenue recognition hurdles, with enterprise quota targets conventionally established at 4x to 6x OTE for high-margin SaaS or 8x to 12x for hardware and wholesale distribution.

Default: $1,300,000
base_salary_compensationMonetary Currency Rate ($ / £ / € / ¥ per period or year)

Fixed contractual base salary paid irrespective of deal volume, serving as the non-variable income foundation of On-Target Earnings (OTE). Standard B2B sales benchmarks mandate a 50:50 base-to-variable compensation mix for Account Executives (AEs) and 70:30 for Solutions Engineers (SEs), compliant with statutory FLSA exempt salary thresholds.

Default: $100,000
sales_quota_targetMonetary Currency Target ($ / £ / € / ¥)

Contractually assigned performance benchmark representing 100% quota attainment where full on-target variable compensation is vested. Standard corporate distribution models target 60% to 70% rep attainment across the sales organization, establishing the hurdle rate before marginal quota accelerators trigger.

Default: $1,000,000
commission_structure_typeCategorical Selection (Flat, Tiered Marginal, Accelerators, Gross Margin)

The governing contractual commission formula: Flat (fixed uniform percentage), Tiered Marginal (progressive tax-bracket style rates), Quota Accelerators (super-linear multipliers exceeding 100% quota), or Gross Margin Split (commissions indexed to net profit contribution after deducting COGS).

Default: Quota Accelerator Tiers
base_commission_ratePercentage Rate (%)

Standard baseline commission percentage earned on closed revenue or gross margin up to 100% quota attainment. Market median benchmarks range between 8% and 12% of ACV in enterprise software, 2% to 5% of top-line revenue in wholesale distribution, or 20% to 35% of gross profit margin in manufacturing.

Default: 10.0%
draw_guarantee_amountMonetary Currency Advance ($ / £ / € / ¥)

Contractual periodic cash advance disbursed at the beginning of a pay cycle to provide predictable baseline liquidity during onboarding ramp-up windows (typically 3 to 6 months), reconciled against earned commissions at reconciliation close.

Default: $0.00
draw_recovery_classificationCategorical Selection (Recoverable vs Non-Recoverable)

Legal recourse classification for commission shortfalls: Recoverable draws obligate the producer to carry forward unearned advances as negative balances offset against future commissions; Non-Recoverable draws constitute guaranteed minimum compensation with zero post-termination employee liability under state wage statutes (e.g., California Labor Code § 221).

Default: None
rep_split_percentagePercentage Allocation (%)

Contractual allocation percentage of the total deal commission pool assigned to the primary sales producer. Governed by multi-touch sales Rules of Engagement (ROE), typically apportioning 60% to 70% to the closing Account Executive, 15% to 20% to the Solutions Architect, and 10% to 15% to pipeline origination SDRs.

Default: 100.0%

Pro Tips & Best Practices

Marginal Graduated Tiers vs Retroactive Cliff Accelerators

Always inspect whether your compensation agreement specifies progressive marginal tiers or retroactive cliff accelerators. Marginal tiers operate like progressive tax brackets: crossing 100% quota elevates the commission rate (e.g., from 10% to 18%) solely on incremental revenue booked above $1,000,000. Conversely, retroactive cliff accelerators re-rate all dollars from dollar one back to zero at the higher rate, creating severe end-of-quarter moral hazards where reps offer 30% unapproved price concessions or pull future pipeline forward just to trip a cliff threshold.

The Recoverable Draw Debt Spiral and Rollover Deficits

A recoverable draw operates as an employer-extended non-interest loan collateralized against future commissions. If your monthly draw is $5,000 but closed production generates only $2,000 in commissions, the $3,000 deficit carries forward into the subsequent cycle. In a subsequent month where you book $8,000 in gross commission, the employer recoups the $3,000 prior shortfall alongside the $5,000 advance, leaving $0 in surplus cash. Ensure compensation contracts specify whether unrecovered draws are capped, forgiven after a ramp period, or legally enforceable upon termination.

Top-Line Revenue vs Gross Margin Commission Alignment

Commission structures tied to gross margin (Revenue minus Cost of Goods Sold) eliminate operational misalignment between sales volume and corporate EBITDA. When commissions scale with gross revenue, reps are incentivized to grant price discounts to accelerate closed deals. Under gross margin compensation, discounting directly degrades variable pay: on a $100,000 deal with $60,000 COGS ($40,000 profit, paying $8,000 at 20%), granting a 10% customer discount ($10,000 off) slashes gross profit by 25% to $30,000 and reduces commission to $6,000, enforcing disciplined pricing defense.

Multi-Touch Attribution and Split Commission Rules of Engagement

Formalize explicit multi-stakeholder Rules of Engagement (ROE) to prevent cross-functional commission disputes in complex enterprise deals. Institutional sales organizations define structured attribution splits: 70% to the originating/closing Account Executive, 20% to the Solutions Engineer who verified the technical architecture, and 10% to the Sales Development Representative who qualified the pipeline. Pre-defining attribution percentages at CRM deal creation prevents retroactive payroll holdbacks and disputes.

Common Gotchas & Troubleshooting

⚠️Commission payout is lower than expected after exceeding sales quota

Verify whether your compensation contract utilizes marginal accelerator tiers rather than retroactive dollar-one accelerators. Marginal tiers apply elevated incentive multipliers (e.g., 1.5x or 2.0x) exclusively to sales booked in excess of the 100% quota threshold, not the full revenue baseline. Additionally, confirm whether client invoice cash collections must clear net-30/60 day receipt terms before variable commissions vest, or if your plan enforces an annual earnings deceleration cap.

⚠️Paycheck shows zero or reduced variable pay despite strong deal bookings

Under recoverable draw schedules, prior performance cycle deficits are automatically recouped before net surplus variable pay is disbursed. Inspect your payroll itemization report for 'Unrecovered Draw Balance' or 'Prior Period Carryover Deficit'. If previous months produced commission shortages against your baseline draw advance, 100% of current commissions are applied toward liquidating that outstanding balance before cash payouts resume.

⚠️Commission deductions applied to current paycheck for past customer cancellations (Clawbacks)

Most sales agreements include 90- to 180-day clawback covenants stipulating that if an account terminates for convenience, breaches contract terms, or enters default within a contractual window, previously paid commissions are recouped from current compensation. Request an itemized clawback audit schedule from sales operations to verify the cancellation date, collection status, and confirm deductions reflect net commission earned rather than gross contract value.

⚠️Discrepancy in gross margin commission calculations on discounted products

When variable compensation is linked to gross margin, discounts come 100% out of profit contribution rather than top-line revenue because product COGS remain fixed. For example, on a $50,000 deal with $30,000 fixed delivery COGS, baseline gross profit is $20,000 (earning $4,000 at 20%). A 10% customer concession ($5,000 reduction) cuts profit to $15,000, slashing earned commission by 25% down to $3,000. Verify that your CPQ software calculates commission against net realized price rather than list price.

Frequently Asked Questions

How do you calculate sales commission with tiered rates?▼

To calculate tiered sales commission, partition total sales into successive bracket thresholds and multiply the revenue in each bracket by its corresponding marginal commission rate: Total Commission = Sum of (Bracket Revenue * Marginal Tier Rate). For example, with tiers of 5% on the first $50,000 and 10% on sales between $50,000 and $100,000, an $80,000 booking generates ($50,000 * 0.05 = $2,500) + ($30,000 * 0.10 = $3,000) = $5,500 total commission, resulting in an effective blended rate of 6.875%.

What is the difference between a recoverable and non-recoverable draw?▼

A non-recoverable draw is a guaranteed minimum income payment that a sales representative keeps permanently regardless of performance, whereas a recoverable draw is a repayable cash advance against future commissions where any deficit between earned commissions and the advance amount accumulates as debt that must be repaid from future paychecks. If a rep earns $2,000 against a $3,000 draw: with a non-recoverable draw, the rep retains the full $3,000 with zero debt; with a recoverable draw, the rep receives $3,000 but owes a $1,000 deficit balance carried forward into the next commission period.

Is it better to pay sales commission on revenue or gross profit?▼

Paying commission on gross profit (Revenue minus Cost of Goods Sold) is financially superior for enterprise margin health because it penalizes deep discounting and directly aligns employee rewards with corporate net income. Revenue-based commissions (calculated on gross top-line sales) incentivize reps to maximize transaction volume regardless of delivery costs or profitability margins, which works well in near-zero marginal cost industries like SaaS (80%+ gross margins) but triggers severe margin erosion in wholesale distribution, manufacturing, and hardware integration (15%–35% gross margins).

What is an OTE (On-Target Earnings) in sales compensation?▼

On-Target Earnings (OTE) is the total annual cash compensation a sales professional earns upon achieving exactly 100% of their assigned sales quota, mathematically defined as: OTE = Contractual Base Salary + Variable Target Commission. In enterprise technology sales, standard market packages implement a 50/50 OTE split (e.g., $120,000 base + $120,000 variable target = $240,000 total OTE), requiring an annual revenue quota of 4x to 6x OTE ($960,000 to $1,440,000 in closed ARR) to justify capital investment.

How are sales commissions taxed in the United States?▼

Sales commissions are classified by the IRS as supplemental wages under 26 CFR § 31.3402(g)-1 and are subject to mandatory federal income tax withholding at a flat 22% rate for cumulative supplemental earnings up to $1,000,000 within a calendar year (and 37% on amounts exceeding $1,000,000), alongside 6.2% Social Security tax up to the annual wage ceiling, 1.45% Medicare tax (plus 0.9% Additional Medicare Tax over $200,000 single filers), and applicable state and local withholding. When large quarterly commission payouts occur, actual year-end tax liability is reconciled based on the taxpayer's ordinary marginal income tax brackets, often yielding a tax refund if withholding exceeded the effective annual rate or a balance due if commissions pushed total income into a higher federal bracket.

What happens to sales commission if a customer cancels or requests a refund?▼

When a customer cancels, defaults, or exercises a refund within the contractual clawback window (typically 90 to 180 days post-sale), the employer reverses the transaction and deducts the previously disbursed commission from the sales representative's future commission earnings. Commission plans govern this via an explicit clawback covenant stipulating that commissions are not legally fully vested until the customer completes payment and passes the refund period, preventing uncollectible accounts receivable from inflating net sales compensation.

What is a typical sales commission rate across industries?▼

Disclaimer: This tool is provided strictly for educational and informational purposes only and does not constitute formal financial advice or a binding loan commitment. Please consult a qualified financial advisor before making decisions. Typical sales commission rates vary based on gross profit margin and capital intensity: B2B Enterprise SaaS ranges from 8% to 12% of Annual Contract Value (ACV) or 15% to 25% of First-Year ARR; Commercial Real Estate averages 3% to 6% of total lease or transaction value; Wholesale Distribution and Manufacturing ranges from 2% to 5% of top-line revenue or 15% to 30% of realized gross profit; Medical Device Sales averages 10% to 18% of net sales; and Property & Casualty Insurance pays 10% to 15% of annual policy premiums.
Related Tools & Utilities

All Tools →