Break-Even Point & Target Profit Calculator

Break-Even Point & Target Profit Calculator

Calculate your break-even point in units and sales revenue with target profit analysis, contribution margin ratio, and dynamic fixed cost sensitivity charts.

100% Client-Side Privacy
Badge zero server
Presets
Card input title
$15,000.00
Hint fixed costs
$50.00
Hint unit price
$20.00
Hint unit variable cost
1,000 Unit items
Hint expected sales
Kpi break even units
500Unit items

Hint be units

Kpi break even revenue
$25,000.00

Hint be revenue

Kpi contribution margin
$30.00

Hint cm

Kpi contribution margin ratio
60.0%

Hint cmr

Lbl operating statusStatus robust
Lbl expected revenue$50,000.00
Lbl total cost expected$35,000.00
Lbl net profit expected$15,000.00
Lbl target goal ($5,000.00)
666.7 Unit items$33,333.33
Opt pre tax
Lbl cash solvency
450 Unit items$22,500.00
Hint cash buffer 50 Unit items
Kpi break even units500 Unit items
Kpi break even revenue$25,000.00
Kpi contribution margin ratio60.0%
Lbl mos ratio50.0%
Lbl degree operating leverage2.00x
Lbl operating statusState profit
Disclaimer title

Disclaimer text
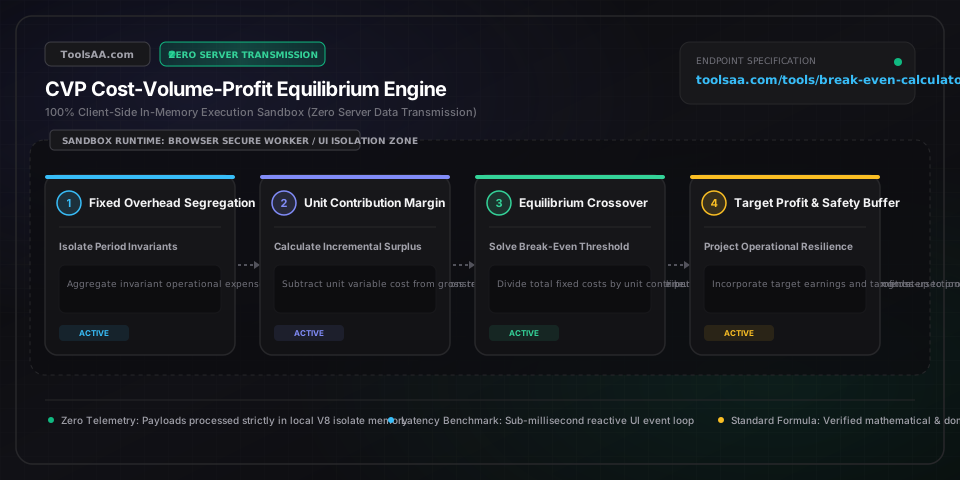
Technical Reference & Architecture Guide

Break-Even Point & Target Profit Calculator Guide

Calculate your break-even point in units and sales revenue with target profit analysis, contribution margin ratio, and dynamic fixed cost sensitivity charts.

Break-Even Point & Target Profit Calculator Guide — Client-Side In-Memory Architecture & Data Flow

Key Parameters & Controls

Total Fixed Costs (FC)Monetary Currency

Operating expenses that remain static regardless of sales volume within the relevant operational range (e.g. commercial leases, full-time administrative payroll, commercial general liability insurance, software licenses).

Default: $12,000
Unit Selling Price (P)Monetary Currency

Net realized cash inflow collected per unit sold after deducting early-payment discounts, statutory sales concessions, or standard wholesale rebates.

Default: $50.00
Unit Variable Cost (VC)Monetary Currency

Direct expenditures incurred strictly when one additional unit is produced or fulfilled (e.g. bill of materials, direct piece-rate labor, shipping postage, credit card merchant interchange).

Default: $20.00
Unit Contribution Margin (CM)Monetary Currency

The exact dollar portion of each unit sale remaining after variable expenses, representing incremental capital available to pay down fixed overhead and accumulate profit (CM = P - VC).

Default: $30.00
Contribution Margin Ratio (CMR)Percentage Ratio

The percentage of each revenue dollar available to cover fixed charges (CMR = CM / P). Asset-heavy retailers typically operate at 15%~30%, whereas digital SaaS platforms frequently exceed 75%~85%.

Default: 60.0%
Margin of Safety (MOS)Percentage Ratio

The percentage drop in forecasted unit sales volume a business can absorb before slipping into operating losses ((Actual Sales - Break-Even Sales) / Actual Sales). Institutional lenders view an MOS >= 25% as financially sound.

Default: 33.3%
Degree of Operating Leverage (DOL)Leverage Multiplier

Ratio measuring the percentage change in operating income resulting from a 1% change in sales volume (DOL = Total CM / Operating Income). High DOL magnifies both profit upside and loss downside.

Default: 3.00x

Pro Tips & Best Practices

The Operating Leverage Paradox: High Margin Amplifies Downside Loss

Companies with high fixed costs and low variable costs (such as SaaS platforms or hotels) boast 80%+ contribution margins, generating explosive EBIT gains during sales expansion. However, if sales contract by even 15%, their fixed cost commitments do not decline, causing operating income to collapse 3x to 5x faster than variable-cost-heavy businesses with flexible labor.

Cash Break-Even vs. Accounting Break-Even: Solvency Triage

During severe cash crunches or supply chain shocks, isolate non-cash depreciation and amortization from your fixed overhead: Cash BEP = (Fixed Costs - D&A) / Unit CM. This calculation yields the exact survival unit threshold required to halt liquid bank reserve depletion, granting operational runway before debt covenants trigger.

The Step-Fixed Cost Cliff: The Production Capacity Trap

Fixed costs remain fixed only within a finite 'relevant range'. Expanding volume beyond factory ceiling or maximum server concurrency triggers sudden step-fixed cliffs—such as leasing a second facility or appointing a night-shift supervisor—instantly shifting your break-even line upward and potentially rendering higher sales less profitable.

The 1% Pricing Leverage Rule: Outperforming Cost Cuts

Extensive empirical corporate finance studies demonstrate that a 1% improvement in net realized price (holding volume constant) expands operating income by an average of 8% to 11%—over three times the profit gain achieved from a 1% reduction in variable procurement costs—because 100% of price gains drop directly to the contribution margin.

Common Gotchas & Troubleshooting

⚠️Negative Contribution Margin Error: Selling Price Lower than Variable Cost

When unit variable cost exceeds unit selling price (P < VC), the unit contribution margin turns negative, rendering break-even mathematically impossible. Every additional sale widens net cash burn. Immediate action: Audit direct supplier bills of materials, renegotiate shipping freight, or increase retail price to restore positive unit margin.

⚠️Calculated Break-Even Units Exceed Maximum Operational Plant Capacity

If the computed break-even volume Q_be is higher than your maximum monthly physical throughput or billable labor hours, your business model possesses a structural deficit. You must convert fixed overhead into variable subcontracts, raise prices, or eliminate bottleneck steps to elevate factory yield.

⚠️Tiered Volume Discounts and Freight Rebates Distorting CVP Linearity

Standard CVP analysis assumes perfectly linear prices and variable costs. In real-world enterprise operations, tiered supplier volume breaks and customer bulk discounts curve the cost line. Divide volume into stepped brackets and evaluate piecewise contribution margins for each sales tier.

Frequently Asked Questions

How do you calculate the break-even point in units and sales dollars?▼

To calculate break-even in units, divide total fixed costs by the unit contribution margin: Units = Fixed Costs / (Price - Variable Cost). To calculate break-even in sales revenue, divide total fixed costs by the contribution margin ratio: Revenue = Fixed Costs / ((Price - Variable Cost) / Price). For example, with $12,000 fixed costs, a $50 selling price, and $20 variable cost, the unit contribution margin is $30, requiring exactly 400 units ($20,000 in gross revenue) to break even.

What is a good margin of safety percentage for a commercial business?▼

A healthy margin of safety benchmark typically ranges between 20% and 30% for diversified consumer goods and manufacturing enterprises, whereas high-volatility industries (such as restaurants and seasonal tourism) require a 35% to 45% cushion. A margin of safety falling below 15% signals high financial vulnerability, where minor revenue downturns or macro pricing pressure will push operating income into net losses.

What is the key difference between Contribution Margin and Gross Margin?▼

Gross Margin is an external GAAP/IFRS financial accounting metric that subtracts Cost of Goods Sold (including allocated fixed factory overhead) from sales revenue. In contrast, Contribution Margin is a managerial decision-making metric that deducts strictly variable costs (including variable selling, general, and administrative costs like sales commissions and credit card fees) from revenue, entirely excluding fixed overhead.

How do you calculate break-even when targeting a specific net profit after taxes?▼

Disclaimer: This tool is provided strictly for educational and informational purposes only and does not constitute formal financial advice or a binding loan commitment. Please consult a qualified financial advisor before making decisions. When targeting an after-tax profit, the target profit must first be converted to a pre-tax operating income equivalent by dividing it by (1 - Effective Tax Rate). The formula is: Required Units = (Fixed Costs + [Target Net Profit / (1 - Tax Rate)]) / (Price - Variable Cost). For instance, targeting $15,000 net profit under a 25% tax rate requires generating $20,000 in pre-tax operating income ($15,000 / 0.75), which is then added to fixed overhead before dividing by unit contribution margin.

Related Tools & Utilities

All Tools →